White/Caucasian vs Immigrants from Nepal 12th Grade, No Diploma

COMPARE

White/Caucasian
Race
Ancestry
AfghanAfricanAlaska NativeAlaskan AthabascanAlbanianAleutAlsatianAmericanApacheArabArapahoArgentineanArmenianAssyrian/Chaldean/SyriacAustralianAustrianBahamianBangladeshiBarbadianBasqueBelgianBelizeanBermudanBhutaneseBlackfeetBolivianBrazilianBritishBritish West IndianBulgarianBurmeseCajunCambodianCanadianCape VerdeanCarpatho RusynCelticCentral AmericanCentral American IndianCherokeeCheyenneChickasawChileanChineseChippewaChoctawColombianColvilleComancheCosta RicanCreeCreekCroatianCrowCubanCypriotCzechCzechoslovakianDanishDelawareDominicanDutchDutch West IndianEastern EuropeanEcuadorianEgyptianEnglishEstonianEthiopianEuropeanFijianFilipinoFinnishFrenchFrench American IndianFrench CanadianGermanGerman RussianGhanaianGreekGuamanian/ChamorroGuatemalanGuyaneseHaitianHmongHonduranHopiHoumaHungarianIcelanderIndian (Asian)IndonesianInupiatIranianIraqiIrishIroquoisIsraeliItalianJamaicanJapaneseJordanianKenyanKiowaKoreanLaotianLatvianLebaneseLiberianLithuanianLumbeeLuxembourgerMacedonianMalaysianMalteseMarshalleseMenomineeMexicanMexican American IndianMongolianMoroccanNative HawaiianNavajoNepaleseNew ZealanderNicaraguanNigerianNorthern EuropeanNorwegianOkinawanOsageOttawaPaiutePakistaniPalestinianPanamanianParaguayanPennsylvania GermanPeruvianPimaPolishPortuguesePotawatomiPuebloPuerto RicanPuget Sound SalishRomanianRussianSalvadoranSamoanScandinavianScotch-IrishScottishSeminoleSenegaleseSerbianShoshoneSierra LeoneanSiouxSlavicSlovakSloveneSomaliSouth AfricanSouth AmericanSouth American IndianSoviet UnionSpaniardSpanishSpanish AmericanSpanish American IndianSri LankanSubsaharan AfricanSudaneseSwedishSwissSyrianTaiwaneseThaiTlingit-HaidaTohono O'OdhamTonganTrinidadian and TobagonianTsimshianTurkishU.S. Virgin IslanderUgandanUkrainianUruguayanUteVenezuelanVietnameseWelshWest IndianYakamaYaquiYugoslavianYumanYup'ikZimbabwean
Immigration
NonimmigrantsImmigrantsAfghanistanAfricaAlbaniaArgentinaArmeniaAsiaAustraliaAustriaBahamasBangladeshBarbadosBelarusBelgiumBelizeBoliviaBosnia and HerzegovinaBrazilBulgariaBurma/MyanmarCabo VerdeCambodiaCameroonCanadaCaribbeanCentral AmericaChileChinaColombiaCongoCosta RicaCroatiaCubaCzechoslovakiaDenmarkDominicaDominican RepublicEastern AfricaEastern AsiaEastern EuropeEcuadorEgyptEl SalvadorEnglandEritreaEthiopiaEuropeFijiFranceGermanyGhanaGreeceGrenadaGuatemalaGuyanaHaitiHondurasHong KongHungaryIndiaIndonesiaIranIraqIrelandIsraelItalyJamaicaJapanJordanKazakhstanKenyaKoreaKuwaitLaosLatin AmericaLatviaLebanonLiberiaLithuaniaMalaysiaMexicoMicronesiaMiddle AfricaMoldovaMoroccoNetherlandsNicaraguaNigeriaNorth AmericaNorth MacedoniaNorthern AfricaNorthern EuropeNorwayOceaniaPakistanPanamaPeruPhilippinesPolandPortugalRomaniaRussiaSaudi ArabiaScotlandSenegalSerbiaSierra LeoneSingaporeSomaliaSouth AfricaSouth AmericaSouth Central AsiaSouth Eastern AsiaSouthern EuropeSpainSri LankaSt. Vincent and the GrenadinesSudanSwedenSwitzerlandSyriaTaiwanThailandTrinidad and TobagoTurkeyUgandaUkraineUruguayUzbekistanVenezuelaVietnamWest IndiesWestern AfricaWestern AsiaWestern EuropeYemenZaireZimbabweAzores
Immigrants from Nepal
Race
Ancestry
AfghanAfricanAlaska NativeAlaskan AthabascanAlbanianAleutAlsatianAmericanApacheArabArapahoArgentineanArmenianAssyrian/Chaldean/SyriacAustralianAustrianBahamianBangladeshiBarbadianBasqueBelgianBelizeanBermudanBhutaneseBlackfeetBolivianBrazilianBritishBritish West IndianBulgarianBurmeseCajunCambodianCanadianCape VerdeanCarpatho RusynCelticCentral AmericanCentral American IndianCherokeeCheyenneChickasawChileanChineseChippewaChoctawColombianColvilleComancheCosta RicanCreeCreekCroatianCrowCubanCypriotCzechCzechoslovakianDanishDelawareDominicanDutchDutch West IndianEastern EuropeanEcuadorianEgyptianEnglishEstonianEthiopianEuropeanFijianFilipinoFinnishFrenchFrench American IndianFrench CanadianGermanGerman RussianGhanaianGreekGuamanian/ChamorroGuatemalanGuyaneseHaitianHmongHonduranHopiHoumaHungarianIcelanderIndian (Asian)IndonesianInupiatIranianIraqiIrishIroquoisIsraeliItalianJamaicanJapaneseJordanianKenyanKiowaKoreanLaotianLatvianLebaneseLiberianLithuanianLumbeeLuxembourgerMacedonianMalaysianMalteseMarshalleseMenomineeMexicanMexican American IndianMongolianMoroccanNative HawaiianNavajoNepaleseNew ZealanderNicaraguanNigerianNorthern EuropeanNorwegianOkinawanOsageOttawaPaiutePakistaniPalestinianPanamanianParaguayanPennsylvania GermanPeruvianPimaPolishPortuguesePotawatomiPuebloPuerto RicanPuget Sound SalishRomanianRussianSalvadoranSamoanScandinavianScotch-IrishScottishSeminoleSenegaleseSerbianShoshoneSierra LeoneanSiouxSlavicSlovakSloveneSomaliSouth AfricanSouth AmericanSouth American IndianSoviet UnionSpaniardSpanishSpanish AmericanSpanish American IndianSri LankanSubsaharan AfricanSudaneseSwedishSwissSyrianTaiwaneseThaiTlingit-HaidaTohono O'OdhamTonganTrinidadian and TobagonianTsimshianTurkishU.S. Virgin IslanderUgandanUkrainianUruguayanUteVenezuelanVietnameseWelshWest IndianYakamaYaquiYugoslavianYumanYup'ikZimbabwean
Immigration
NonimmigrantsImmigrantsAfghanistanAfricaAlbaniaArgentinaArmeniaAsiaAustraliaAustriaBahamasBangladeshBarbadosBelarusBelgiumBelizeBoliviaBosnia and HerzegovinaBrazilBulgariaBurma/MyanmarCabo VerdeCambodiaCameroonCanadaCaribbeanCentral AmericaChileChinaColombiaCongoCosta RicaCroatiaCubaCzechoslovakiaDenmarkDominicaDominican RepublicEastern AfricaEastern AsiaEastern EuropeEcuadorEgyptEl SalvadorEnglandEritreaEthiopiaEuropeFijiFranceGermanyGhanaGreeceGrenadaGuatemalaGuyanaHaitiHondurasHong KongHungaryIndiaIndonesiaIranIraqIrelandIsraelItalyJamaicaJapanJordanKazakhstanKenyaKoreaKuwaitLaosLatin AmericaLatviaLebanonLiberiaLithuaniaMalaysiaMexicoMicronesiaMiddle AfricaMoldovaMoroccoNepalNetherlandsNicaraguaNigeriaNorth AmericaNorth MacedoniaNorthern AfricaNorthern EuropeNorwayOceaniaPakistanPanamaPeruPhilippinesPolandPortugalRomaniaRussiaSaudi ArabiaScotlandSenegalSerbiaSierra LeoneSingaporeSomaliaSouth AfricaSouth AmericaSouth Central AsiaSouth Eastern AsiaSouthern EuropeSpainSri LankaSt. Vincent and the GrenadinesSudanSwedenSwitzerlandSyriaTaiwanThailandTrinidad and TobagoTurkeyUgandaUkraineUruguayUzbekistanVenezuelaVietnamWest IndiesWestern AfricaWestern AsiaWestern EuropeYemenZaireZimbabweAzores
12th Grade, No Diploma
Income
Poverty
Unemployment
Labor Participation
Family Structure
Vehicle Availability
Education Level
Disability

12th Grade, No Diploma Comparison

Whites/Caucasians

Immigrants from Nepal

Exceptional
Average
91.8%
12TH GRADE, NO DIPLOMA
91.6/ 100
METRIC RATING
125th/ 347
METRIC RANK
91.2%
12TH GRADE, NO DIPLOMA
50.0/ 100
METRIC RATING
174th/ 347
METRIC RANK

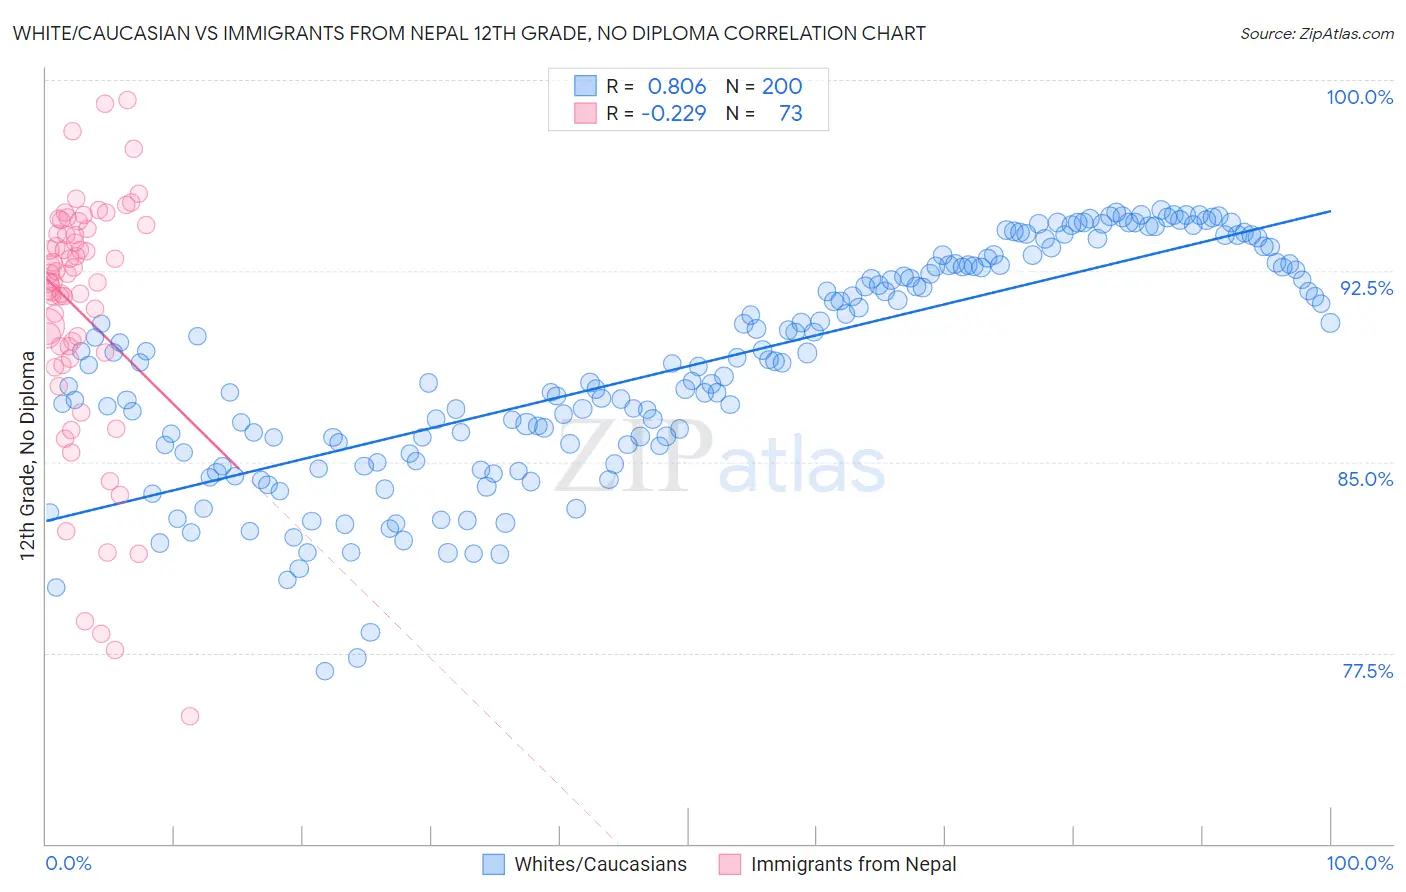
White/Caucasian vs Immigrants from Nepal 12th Grade, No Diploma Correlation Chart

The statistical analysis conducted on geographies consisting of 585,243,214 people shows a very strong positive correlation between the proportion of Whites/Caucasians and percentage of population with at least 12th grade (no diploma) education in the United States with a correlation coefficient (R) of 0.806 and weighted average of 91.8%. Similarly, the statistical analysis conducted on geographies consisting of 186,780,807 people shows a weak negative correlation between the proportion of Immigrants from Nepal and percentage of population with at least 12th grade (no diploma) education in the United States with a correlation coefficient (R) of -0.229 and weighted average of 91.2%, a difference of 0.73%.
White/Caucasian vs Immigrants from Nepal 12th Grade, No Diploma

12th Grade, No Diploma Correlation Summary

MeasurementWhite/CaucasianImmigrants from Nepal
Minimum76.8%75.0%
Maximum94.9%99.2%
Range18.1%24.2%
Mean88.8%90.9%
Median88.9%92.1%
Interquartile 25% (IQ1)85.6%89.2%
Interquartile 75% (IQ3)92.7%94.0%
Interquartile Range (IQR)7.1%4.9%
Standard Deviation (Sample)4.4%5.0%
Standard Deviation (Population)4.4%4.9%

Similar Demographics by 12th Grade, No Diploma

Demographics Similar to Whites/Caucasians by 12th Grade, No Diploma

In terms of 12th grade, no diploma, the demographic groups most similar to Whites/Caucasians are Immigrants from Ukraine (91.8%, a difference of 0.0%), Basque (91.8%, a difference of 0.010%), Immigrants from Jordan (91.8%, a difference of 0.020%), Egyptian (91.9%, a difference of 0.040%), and Mongolian (91.8%, a difference of 0.060%).
DemographicsRating | Rank12th Grade, No Diploma
Puget Sound Salish
95.8
/100
|
#118
Exceptional
92.0%
Immigrants | Germany
95.5
/100
|
#119
Exceptional
92.0%
Immigrants | Kazakhstan
94.2
/100
|
#120
Exceptional
91.9%
Menominee
93.5
/100
|
#121
Exceptional
91.9%
Ottawa
93.1
/100
|
#122
Exceptional
91.9%
Egyptians
92.5
/100
|
#123
Exceptional
91.9%
Immigrants | Ukraine
91.6
/100
|
#124
Exceptional
91.8%
Whites/Caucasians
91.6
/100
|
#125
Exceptional
91.8%
Basques
91.3
/100
|
#126
Exceptional
91.8%
Immigrants | Jordan
91.0
/100
|
#127
Exceptional
91.8%
Mongolians
89.9
/100
|
#128
Excellent
91.8%
German Russians
89.8
/100
|
#129
Excellent
91.8%
Assyrians/Chaldeans/Syriacs
89.6
/100
|
#130
Excellent
91.8%
Albanians
89.3
/100
|
#131
Excellent
91.8%
Immigrants | Eastern Asia
89.3
/100
|
#132
Excellent
91.8%

Demographics Similar to Immigrants from Nepal by 12th Grade, No Diploma

In terms of 12th grade, no diploma, the demographic groups most similar to Immigrants from Nepal are Bolivian (91.2%, a difference of 0.0%), Bermudan (91.2%, a difference of 0.010%), Immigrants from Western Asia (91.2%, a difference of 0.010%), Immigrants from Morocco (91.2%, a difference of 0.020%), and Iroquois (91.1%, a difference of 0.020%).
DemographicsRating | Rank12th Grade, No Diploma
Immigrants | Malaysia
57.8
/100
|
#167
Average
91.3%
Cree
57.0
/100
|
#168
Average
91.2%
Immigrants | Indonesia
54.9
/100
|
#169
Average
91.2%
Delaware
52.8
/100
|
#170
Average
91.2%
Immigrants | Morocco
51.4
/100
|
#171
Average
91.2%
Bermudans
50.8
/100
|
#172
Average
91.2%
Bolivians
50.4
/100
|
#173
Average
91.2%
Immigrants | Nepal
50.0
/100
|
#174
Average
91.2%
Immigrants | Western Asia
49.0
/100
|
#175
Average
91.2%
Iroquois
48.5
/100
|
#176
Average
91.1%
Sierra Leoneans
47.7
/100
|
#177
Average
91.1%
Spanish
43.7
/100
|
#178
Average
91.1%
Immigrants | Chile
43.3
/100
|
#179
Average
91.1%
Immigrants | Syria
40.3
/100
|
#180
Average
91.1%
Guamanians/Chamorros
39.5
/100
|
#181
Fair
91.0%