White/Caucasian vs Houma 12th Grade, No Diploma

COMPARE

White/Caucasian
Race
Ancestry
AfghanAfricanAlaska NativeAlaskan AthabascanAlbanianAleutAlsatianAmericanApacheArabArapahoArgentineanArmenianAssyrian/Chaldean/SyriacAustralianAustrianBahamianBangladeshiBarbadianBasqueBelgianBelizeanBermudanBhutaneseBlackfeetBolivianBrazilianBritishBritish West IndianBulgarianBurmeseCajunCambodianCanadianCape VerdeanCarpatho RusynCelticCentral AmericanCentral American IndianCherokeeCheyenneChickasawChileanChineseChippewaChoctawColombianColvilleComancheCosta RicanCreeCreekCroatianCrowCubanCypriotCzechCzechoslovakianDanishDelawareDominicanDutchDutch West IndianEastern EuropeanEcuadorianEgyptianEnglishEstonianEthiopianEuropeanFijianFilipinoFinnishFrenchFrench American IndianFrench CanadianGermanGerman RussianGhanaianGreekGuamanian/ChamorroGuatemalanGuyaneseHaitianHmongHonduranHopiHungarianIcelanderIndian (Asian)IndonesianInupiatIranianIraqiIrishIroquoisIsraeliItalianJamaicanJapaneseJordanianKenyanKiowaKoreanLaotianLatvianLebaneseLiberianLithuanianLumbeeLuxembourgerMacedonianMalaysianMalteseMarshalleseMenomineeMexicanMexican American IndianMongolianMoroccanNative HawaiianNavajoNepaleseNew ZealanderNicaraguanNigerianNorthern EuropeanNorwegianOkinawanOsageOttawaPaiutePakistaniPalestinianPanamanianParaguayanPennsylvania GermanPeruvianPimaPolishPortuguesePotawatomiPuebloPuerto RicanPuget Sound SalishRomanianRussianSalvadoranSamoanScandinavianScotch-IrishScottishSeminoleSenegaleseSerbianShoshoneSierra LeoneanSiouxSlavicSlovakSloveneSomaliSouth AfricanSouth AmericanSouth American IndianSoviet UnionSpaniardSpanishSpanish AmericanSpanish American IndianSri LankanSubsaharan AfricanSudaneseSwedishSwissSyrianTaiwaneseThaiTlingit-HaidaTohono O'OdhamTonganTrinidadian and TobagonianTsimshianTurkishU.S. Virgin IslanderUgandanUkrainianUruguayanUteVenezuelanVietnameseWelshWest IndianYakamaYaquiYugoslavianYumanYup'ikZimbabwean
Immigration
NonimmigrantsImmigrantsAfghanistanAfricaAlbaniaArgentinaArmeniaAsiaAustraliaAustriaBahamasBangladeshBarbadosBelarusBelgiumBelizeBoliviaBosnia and HerzegovinaBrazilBulgariaBurma/MyanmarCabo VerdeCambodiaCameroonCanadaCaribbeanCentral AmericaChileChinaColombiaCongoCosta RicaCroatiaCubaCzechoslovakiaDenmarkDominicaDominican RepublicEastern AfricaEastern AsiaEastern EuropeEcuadorEgyptEl SalvadorEnglandEritreaEthiopiaEuropeFijiFranceGermanyGhanaGreeceGrenadaGuatemalaGuyanaHaitiHondurasHong KongHungaryIndiaIndonesiaIranIraqIrelandIsraelItalyJamaicaJapanJordanKazakhstanKenyaKoreaKuwaitLaosLatin AmericaLatviaLebanonLiberiaLithuaniaMalaysiaMexicoMicronesiaMiddle AfricaMoldovaMoroccoNepalNetherlandsNicaraguaNigeriaNorth AmericaNorth MacedoniaNorthern AfricaNorthern EuropeNorwayOceaniaPakistanPanamaPeruPhilippinesPolandPortugalRomaniaRussiaSaudi ArabiaScotlandSenegalSerbiaSierra LeoneSingaporeSomaliaSouth AfricaSouth AmericaSouth Central AsiaSouth Eastern AsiaSouthern EuropeSpainSri LankaSt. Vincent and the GrenadinesSudanSwedenSwitzerlandSyriaTaiwanThailandTrinidad and TobagoTurkeyUgandaUkraineUruguayUzbekistanVenezuelaVietnamWest IndiesWestern AfricaWestern AsiaWestern EuropeYemenZaireZimbabweAzores
Houma
Race
Ancestry
AfghanAfricanAlaska NativeAlaskan AthabascanAlbanianAleutAlsatianAmericanApacheArabArapahoArgentineanArmenianAssyrian/Chaldean/SyriacAustralianAustrianBahamianBangladeshiBarbadianBasqueBelgianBelizeanBermudanBhutaneseBlackfeetBolivianBrazilianBritishBritish West IndianBulgarianBurmeseCajunCambodianCanadianCape VerdeanCarpatho RusynCelticCentral AmericanCentral American IndianCherokeeCheyenneChickasawChileanChineseChippewaChoctawColombianColvilleComancheCosta RicanCreeCreekCroatianCrowCubanCypriotCzechCzechoslovakianDanishDelawareDominicanDutchDutch West IndianEastern EuropeanEcuadorianEgyptianEnglishEstonianEthiopianEuropeanFijianFilipinoFinnishFrenchFrench American IndianFrench CanadianGermanGerman RussianGhanaianGreekGuamanian/ChamorroGuatemalanGuyaneseHaitianHmongHonduranHopiHoumaHungarianIcelanderIndian (Asian)IndonesianInupiatIranianIraqiIrishIroquoisIsraeliItalianJamaicanJapaneseJordanianKenyanKiowaKoreanLaotianLatvianLebaneseLiberianLithuanianLumbeeLuxembourgerMacedonianMalaysianMalteseMarshalleseMenomineeMexicanMexican American IndianMongolianMoroccanNative HawaiianNavajoNepaleseNew ZealanderNicaraguanNigerianNorthern EuropeanNorwegianOkinawanOsageOttawaPaiutePakistaniPalestinianPanamanianParaguayanPennsylvania GermanPeruvianPimaPolishPortuguesePotawatomiPuebloPuerto RicanPuget Sound SalishRomanianRussianSalvadoranSamoanScandinavianScotch-IrishScottishSeminoleSenegaleseSerbianShoshoneSierra LeoneanSiouxSlavicSlovakSloveneSomaliSouth AfricanSouth AmericanSouth American IndianSoviet UnionSpaniardSpanishSpanish AmericanSpanish American IndianSri LankanSubsaharan AfricanSudaneseSwedishSwissSyrianTaiwaneseThaiTlingit-HaidaTohono O'OdhamTonganTrinidadian and TobagonianTsimshianTurkishU.S. Virgin IslanderUgandanUkrainianUruguayanUteVenezuelanVietnameseWelshWest IndianYakamaYaquiYugoslavianYumanYup'ikZimbabwean
Immigration
NonimmigrantsImmigrantsAfghanistanAfricaAlbaniaArgentinaArmeniaAsiaAustraliaAustriaBahamasBangladeshBarbadosBelarusBelgiumBelizeBoliviaBosnia and HerzegovinaBrazilBulgariaBurma/MyanmarCabo VerdeCambodiaCameroonCanadaCaribbeanCentral AmericaChileChinaColombiaCongoCosta RicaCroatiaCubaCzechoslovakiaDenmarkDominicaDominican RepublicEastern AfricaEastern AsiaEastern EuropeEcuadorEgyptEl SalvadorEnglandEritreaEthiopiaEuropeFijiFranceGermanyGhanaGreeceGrenadaGuatemalaGuyanaHaitiHondurasHong KongHungaryIndiaIndonesiaIranIraqIrelandIsraelItalyJamaicaJapanJordanKazakhstanKenyaKoreaKuwaitLaosLatin AmericaLatviaLebanonLiberiaLithuaniaMalaysiaMexicoMicronesiaMiddle AfricaMoldovaMoroccoNepalNetherlandsNicaraguaNigeriaNorth AmericaNorth MacedoniaNorthern AfricaNorthern EuropeNorwayOceaniaPakistanPanamaPeruPhilippinesPolandPortugalRomaniaRussiaSaudi ArabiaScotlandSenegalSerbiaSierra LeoneSingaporeSomaliaSouth AfricaSouth AmericaSouth Central AsiaSouth Eastern AsiaSouthern EuropeSpainSri LankaSt. Vincent and the GrenadinesSudanSwedenSwitzerlandSyriaTaiwanThailandTrinidad and TobagoTurkeyUgandaUkraineUruguayUzbekistanVenezuelaVietnamWest IndiesWestern AfricaWestern AsiaWestern EuropeYemenZaireZimbabweAzores
12th Grade, No Diploma
Income
Poverty
Unemployment
Labor Participation
Family Structure
Vehicle Availability
Education Level
Disability

12th Grade, No Diploma Comparison

Whites/Caucasians

Houma

Exceptional
Tragic
91.8%
12TH GRADE, NO DIPLOMA
91.6/ 100
METRIC RATING
125th/ 347
METRIC RANK
83.7%
12TH GRADE, NO DIPLOMA
0.0/ 100
METRIC RATING
342nd/ 347
METRIC RANK

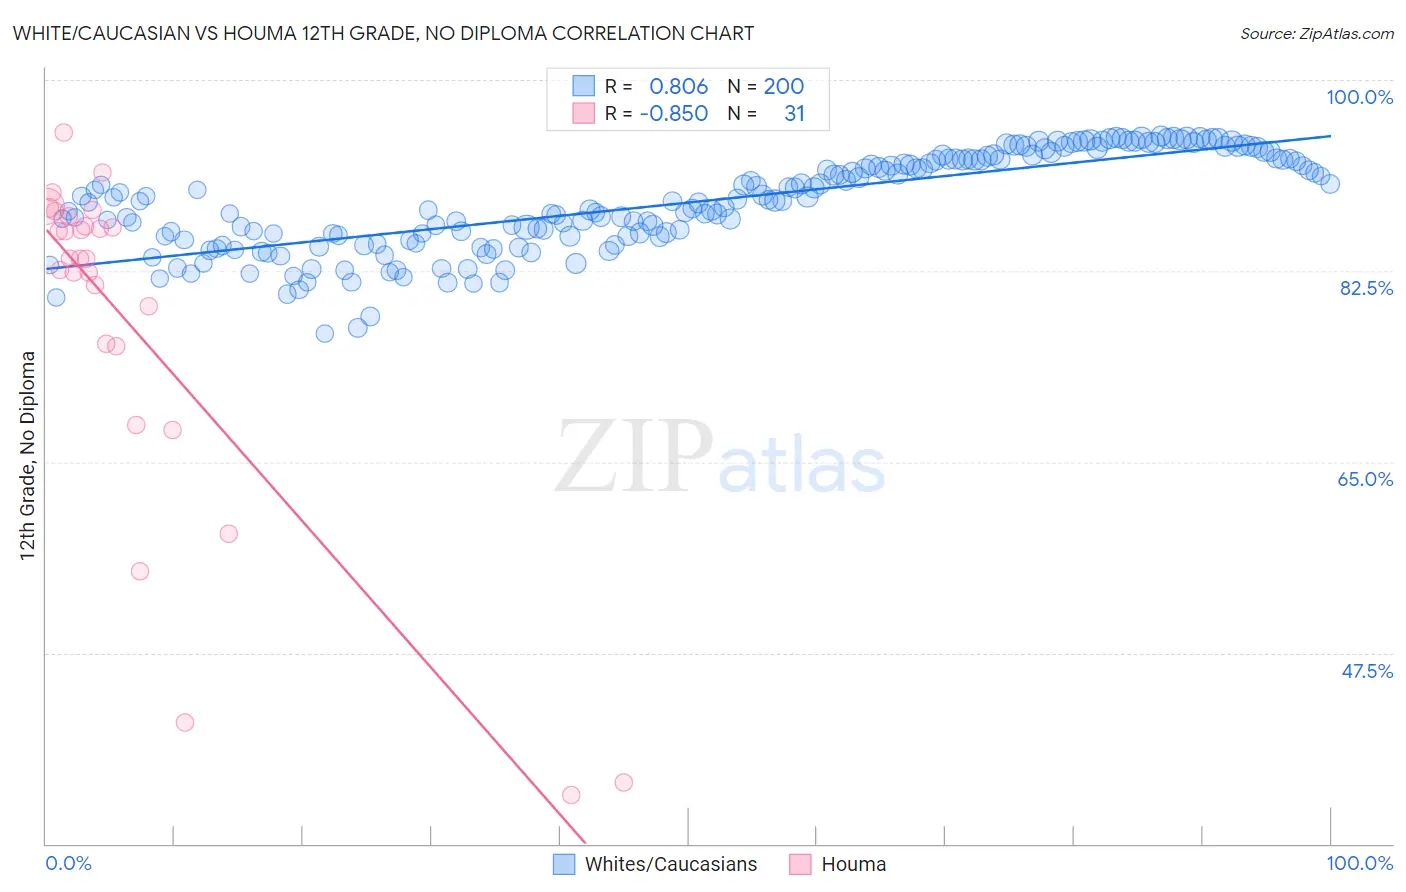
White/Caucasian vs Houma 12th Grade, No Diploma Correlation Chart

The statistical analysis conducted on geographies consisting of 585,243,214 people shows a very strong positive correlation between the proportion of Whites/Caucasians and percentage of population with at least 12th grade (no diploma) education in the United States with a correlation coefficient (R) of 0.806 and weighted average of 91.8%. Similarly, the statistical analysis conducted on geographies consisting of 36,795,916 people shows a very strong negative correlation between the proportion of Houma and percentage of population with at least 12th grade (no diploma) education in the United States with a correlation coefficient (R) of -0.850 and weighted average of 83.7%, a difference of 9.7%.
White/Caucasian vs Houma 12th Grade, No Diploma

12th Grade, No Diploma Correlation Summary

MeasurementWhite/CaucasianHouma
Minimum76.8%34.4%
Maximum94.9%95.2%
Range18.1%60.8%
Mean88.8%77.6%
Median88.9%83.7%
Interquartile 25% (IQ1)85.6%75.6%
Interquartile 75% (IQ3)92.7%87.5%
Interquartile Range (IQR)7.1%11.9%
Standard Deviation (Sample)4.4%16.2%
Standard Deviation (Population)4.4%15.9%

Similar Demographics by 12th Grade, No Diploma

Demographics Similar to Whites/Caucasians by 12th Grade, No Diploma

In terms of 12th grade, no diploma, the demographic groups most similar to Whites/Caucasians are Immigrants from Ukraine (91.8%, a difference of 0.0%), Basque (91.8%, a difference of 0.010%), Immigrants from Jordan (91.8%, a difference of 0.020%), Egyptian (91.9%, a difference of 0.040%), and Mongolian (91.8%, a difference of 0.060%).
DemographicsRating | Rank12th Grade, No Diploma
Puget Sound Salish
95.8
/100
|
#118
Exceptional
92.0%
Immigrants | Germany
95.5
/100
|
#119
Exceptional
92.0%
Immigrants | Kazakhstan
94.2
/100
|
#120
Exceptional
91.9%
Menominee
93.5
/100
|
#121
Exceptional
91.9%
Ottawa
93.1
/100
|
#122
Exceptional
91.9%
Egyptians
92.5
/100
|
#123
Exceptional
91.9%
Immigrants | Ukraine
91.6
/100
|
#124
Exceptional
91.8%
Whites/Caucasians
91.6
/100
|
#125
Exceptional
91.8%
Basques
91.3
/100
|
#126
Exceptional
91.8%
Immigrants | Jordan
91.0
/100
|
#127
Exceptional
91.8%
Mongolians
89.9
/100
|
#128
Excellent
91.8%
German Russians
89.8
/100
|
#129
Excellent
91.8%
Assyrians/Chaldeans/Syriacs
89.6
/100
|
#130
Excellent
91.8%
Albanians
89.3
/100
|
#131
Excellent
91.8%
Immigrants | Eastern Asia
89.3
/100
|
#132
Excellent
91.8%

Demographics Similar to Houma by 12th Grade, No Diploma

In terms of 12th grade, no diploma, the demographic groups most similar to Houma are Immigrants from El Salvador (83.6%, a difference of 0.16%), Immigrants from Guatemala (84.0%, a difference of 0.34%), Mexican (84.1%, a difference of 0.48%), Salvadoran (84.5%, a difference of 0.90%), and Immigrants from Central America (83.0%, a difference of 0.90%).
DemographicsRating | Rank12th Grade, No Diploma
Immigrants | Latin America
0.0
/100
|
#333
Tragic
85.0%
Immigrants | Dominican Republic
0.0
/100
|
#334
Tragic
84.9%
Immigrants | Yemen
0.0
/100
|
#335
Tragic
84.8%
Tohono O'odham
0.0
/100
|
#336
Tragic
84.7%
Pima
0.0
/100
|
#337
Tragic
84.6%
Guatemalans
0.0
/100
|
#338
Tragic
84.6%
Salvadorans
0.0
/100
|
#339
Tragic
84.5%
Mexicans
0.0
/100
|
#340
Tragic
84.1%
Immigrants | Guatemala
0.0
/100
|
#341
Tragic
84.0%
Houma
0.0
/100
|
#342
Tragic
83.7%
Immigrants | El Salvador
0.0
/100
|
#343
Tragic
83.6%
Immigrants | Central America
0.0
/100
|
#344
Tragic
83.0%
Spanish American Indians
0.0
/100
|
#345
Tragic
82.9%
Yakama
0.0
/100
|
#346
Tragic
82.5%
Immigrants | Mexico
0.0
/100
|
#347
Tragic
82.4%