Ute vs Immigrants from China Associate's Degree
COMPARE
Ute
Immigrants from China
Associate's Degree
Associate's Degree Comparison
Ute
Immigrants from China
38.6%
ASSOCIATE'S DEGREE
0.0/ 100
METRIC RATING
299th/ 347
METRIC RANK
55.5%
ASSOCIATE'S DEGREE
100.0/ 100
METRIC RATING
13th/ 347
METRIC RANK
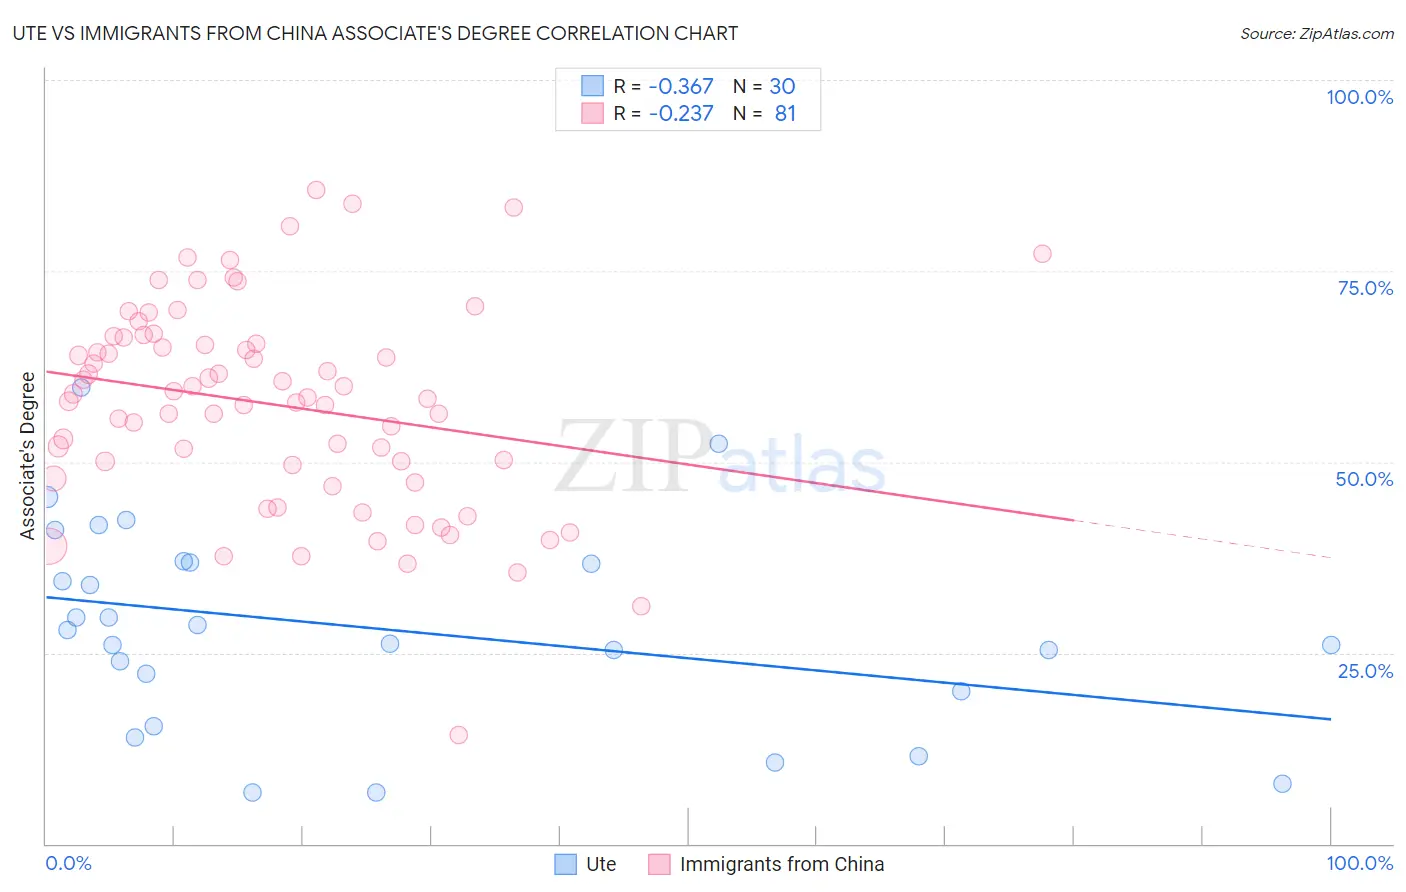
Ute vs Immigrants from China Associate's Degree Correlation Chart
The statistical analysis conducted on geographies consisting of 55,668,197 people shows a mild negative correlation between the proportion of Ute and percentage of population with at least associate's degree education in the United States with a correlation coefficient (R) of -0.367 and weighted average of 38.6%. Similarly, the statistical analysis conducted on geographies consisting of 457,025,047 people shows a weak negative correlation between the proportion of Immigrants from China and percentage of population with at least associate's degree education in the United States with a correlation coefficient (R) of -0.237 and weighted average of 55.5%, a difference of 43.6%.
Associate's Degree Correlation Summary
| Measurement | Ute | Immigrants from China |
| Minimum | 6.7% | 14.2% |
| Maximum | 59.8% | 85.6% |
| Range | 53.1% | 71.4% |
| Mean | 28.2% | 57.5% |
| Median | 27.1% | 58.5% |
| Interquartile 25% (IQ1) | 20.0% | 48.7% |
| Interquartile 75% (IQ3) | 36.8% | 65.9% |
| Interquartile Range (IQR) | 16.8% | 17.2% |
| Standard Deviation (Sample) | 13.3% | 13.4% |
| Standard Deviation (Population) | 13.1% | 13.3% |
Similar Demographics by Associate's Degree
Demographics Similar to Ute by Associate's Degree
In terms of associate's degree, the demographic groups most similar to Ute are Chickasaw (38.6%, a difference of 0.040%), Cheyenne (38.7%, a difference of 0.090%), Tsimshian (38.6%, a difference of 0.090%), Colville (38.5%, a difference of 0.24%), and Guatemalan (38.5%, a difference of 0.33%).
| Demographics | Rating | Rank | Associate's Degree |
| Blacks/African Americans | 0.0 /100 | #292 | Tragic 39.1% |
| Nepalese | 0.0 /100 | #293 | Tragic 39.0% |
| Salvadorans | 0.0 /100 | #294 | Tragic 39.0% |
| Hondurans | 0.0 /100 | #295 | Tragic 38.9% |
| Cherokee | 0.0 /100 | #296 | Tragic 38.9% |
| Cape Verdeans | 0.0 /100 | #297 | Tragic 38.8% |
| Cheyenne | 0.0 /100 | #298 | Tragic 38.7% |
| Ute | 0.0 /100 | #299 | Tragic 38.6% |
| Chickasaw | 0.0 /100 | #300 | Tragic 38.6% |
| Tsimshian | 0.0 /100 | #301 | Tragic 38.6% |
| Colville | 0.0 /100 | #302 | Tragic 38.5% |
| Guatemalans | 0.0 /100 | #303 | Tragic 38.5% |
| Sioux | 0.0 /100 | #304 | Tragic 38.5% |
| Immigrants | Honduras | 0.0 /100 | #305 | Tragic 38.5% |
| Shoshone | 0.0 /100 | #306 | Tragic 38.4% |
Demographics Similar to Immigrants from China by Associate's Degree
In terms of associate's degree, the demographic groups most similar to Immigrants from China are Immigrants from Hong Kong (55.4%, a difference of 0.14%), Immigrants from Eastern Asia (55.4%, a difference of 0.17%), Immigrants from South Central Asia (55.7%, a difference of 0.49%), Immigrants from Australia (55.8%, a difference of 0.61%), and Soviet Union (55.1%, a difference of 0.65%).
| Demographics | Rating | Rank | Associate's Degree |
| Okinawans | 100.0 /100 | #6 | Exceptional 57.7% |
| Immigrants | Iran | 100.0 /100 | #7 | Exceptional 57.7% |
| Thais | 100.0 /100 | #8 | Exceptional 57.4% |
| Immigrants | Israel | 100.0 /100 | #9 | Exceptional 56.8% |
| Cypriots | 100.0 /100 | #10 | Exceptional 56.4% |
| Immigrants | Australia | 100.0 /100 | #11 | Exceptional 55.8% |
| Immigrants | South Central Asia | 100.0 /100 | #12 | Exceptional 55.7% |
| Immigrants | China | 100.0 /100 | #13 | Exceptional 55.5% |
| Immigrants | Hong Kong | 100.0 /100 | #14 | Exceptional 55.4% |
| Immigrants | Eastern Asia | 100.0 /100 | #15 | Exceptional 55.4% |
| Soviet Union | 100.0 /100 | #16 | Exceptional 55.1% |
| Eastern Europeans | 100.0 /100 | #17 | Exceptional 55.0% |
| Indians (Asian) | 100.0 /100 | #18 | Exceptional 54.8% |
| Immigrants | Ireland | 100.0 /100 | #19 | Exceptional 54.7% |
| Cambodians | 100.0 /100 | #20 | Exceptional 54.6% |