Ute vs Alsatian Associate's Degree
COMPARE
Ute
Alsatian
Associate's Degree
Associate's Degree Comparison
Ute
Alsatians
38.6%
ASSOCIATE'S DEGREE
0.0/ 100
METRIC RATING
299th/ 347
METRIC RANK
48.8%
ASSOCIATE'S DEGREE
94.6/ 100
METRIC RATING
120th/ 347
METRIC RANK
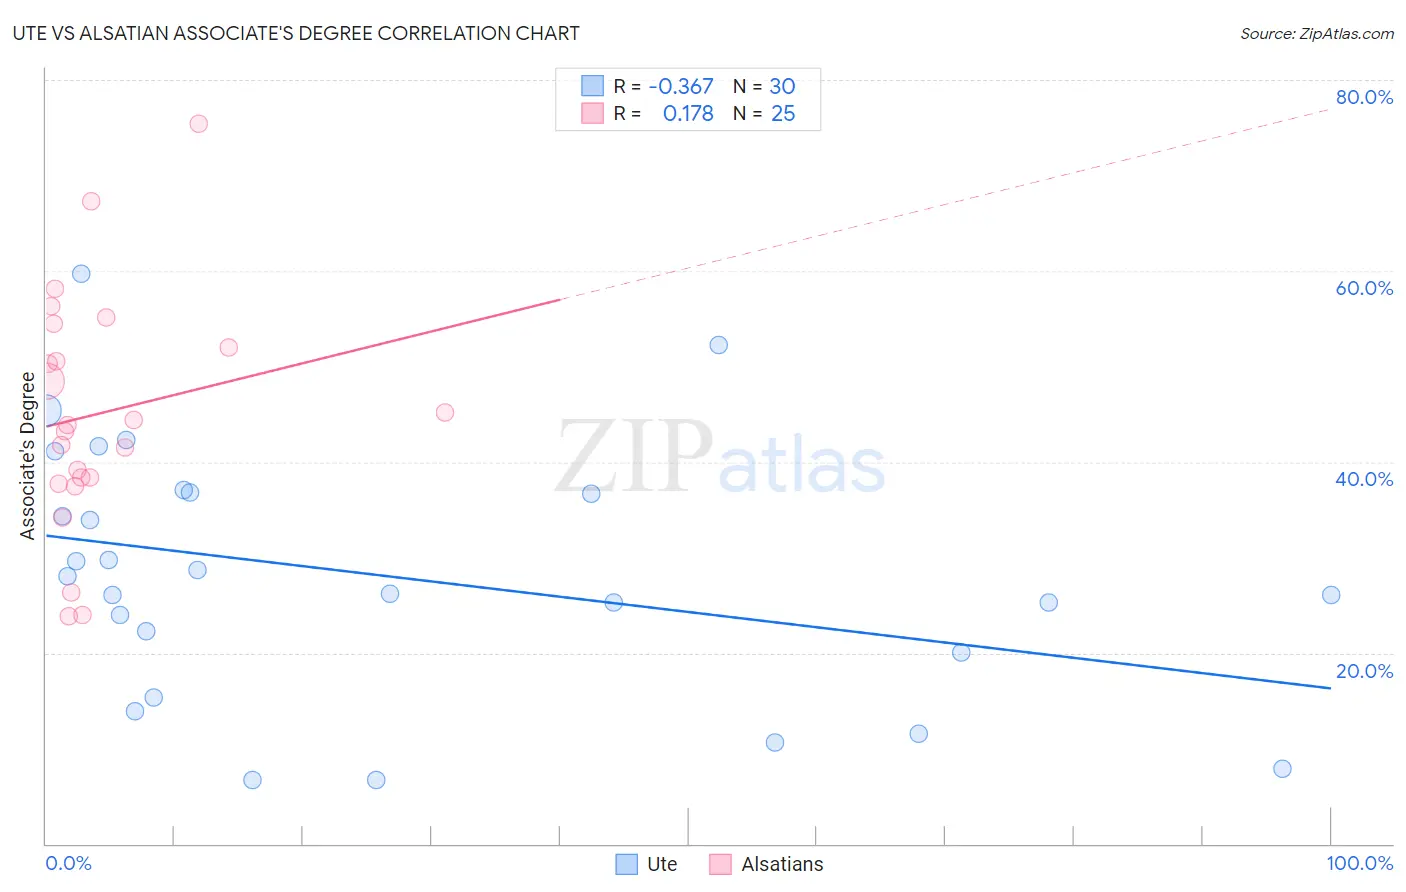
Ute vs Alsatian Associate's Degree Correlation Chart
The statistical analysis conducted on geographies consisting of 55,668,197 people shows a mild negative correlation between the proportion of Ute and percentage of population with at least associate's degree education in the United States with a correlation coefficient (R) of -0.367 and weighted average of 38.6%. Similarly, the statistical analysis conducted on geographies consisting of 82,682,365 people shows a poor positive correlation between the proportion of Alsatians and percentage of population with at least associate's degree education in the United States with a correlation coefficient (R) of 0.178 and weighted average of 48.8%, a difference of 26.4%.
Associate's Degree Correlation Summary
| Measurement | Ute | Alsatian |
| Minimum | 6.7% | 23.9% |
| Maximum | 59.8% | 75.4% |
| Range | 53.1% | 51.6% |
| Mean | 28.2% | 45.1% |
| Median | 27.1% | 43.9% |
| Interquartile 25% (IQ1) | 20.0% | 38.0% |
| Interquartile 75% (IQ3) | 36.8% | 53.2% |
| Interquartile Range (IQR) | 16.8% | 15.2% |
| Standard Deviation (Sample) | 13.3% | 12.3% |
| Standard Deviation (Population) | 13.1% | 12.1% |
Similar Demographics by Associate's Degree
Demographics Similar to Ute by Associate's Degree
In terms of associate's degree, the demographic groups most similar to Ute are Chickasaw (38.6%, a difference of 0.040%), Cheyenne (38.7%, a difference of 0.090%), Tsimshian (38.6%, a difference of 0.090%), Colville (38.5%, a difference of 0.24%), and Guatemalan (38.5%, a difference of 0.33%).
| Demographics | Rating | Rank | Associate's Degree |
| Blacks/African Americans | 0.0 /100 | #292 | Tragic 39.1% |
| Nepalese | 0.0 /100 | #293 | Tragic 39.0% |
| Salvadorans | 0.0 /100 | #294 | Tragic 39.0% |
| Hondurans | 0.0 /100 | #295 | Tragic 38.9% |
| Cherokee | 0.0 /100 | #296 | Tragic 38.9% |
| Cape Verdeans | 0.0 /100 | #297 | Tragic 38.8% |
| Cheyenne | 0.0 /100 | #298 | Tragic 38.7% |
| Ute | 0.0 /100 | #299 | Tragic 38.6% |
| Chickasaw | 0.0 /100 | #300 | Tragic 38.6% |
| Tsimshian | 0.0 /100 | #301 | Tragic 38.6% |
| Colville | 0.0 /100 | #302 | Tragic 38.5% |
| Guatemalans | 0.0 /100 | #303 | Tragic 38.5% |
| Sioux | 0.0 /100 | #304 | Tragic 38.5% |
| Immigrants | Honduras | 0.0 /100 | #305 | Tragic 38.5% |
| Shoshone | 0.0 /100 | #306 | Tragic 38.4% |
Demographics Similar to Alsatians by Associate's Degree
In terms of associate's degree, the demographic groups most similar to Alsatians are Lebanese (48.8%, a difference of 0.020%), Albanian (48.8%, a difference of 0.030%), Afghan (48.9%, a difference of 0.10%), British (48.9%, a difference of 0.14%), and Luxembourger (48.9%, a difference of 0.20%).
| Demographics | Rating | Rank | Associate's Degree |
| Palestinians | 95.3 /100 | #113 | Exceptional 49.0% |
| Arabs | 95.3 /100 | #114 | Exceptional 49.0% |
| Luxembourgers | 95.1 /100 | #115 | Exceptional 48.9% |
| British | 95.0 /100 | #116 | Exceptional 48.9% |
| Afghans | 94.8 /100 | #117 | Exceptional 48.9% |
| Albanians | 94.7 /100 | #118 | Exceptional 48.8% |
| Lebanese | 94.6 /100 | #119 | Exceptional 48.8% |
| Alsatians | 94.6 /100 | #120 | Exceptional 48.8% |
| Ugandans | 93.9 /100 | #121 | Exceptional 48.7% |
| Italians | 93.9 /100 | #122 | Exceptional 48.7% |
| Brazilians | 93.7 /100 | #123 | Exceptional 48.7% |
| Serbians | 92.6 /100 | #124 | Exceptional 48.5% |
| Chinese | 92.5 /100 | #125 | Exceptional 48.5% |
| Immigrants | Syria | 92.2 /100 | #126 | Exceptional 48.5% |
| Immigrants | Uganda | 92.1 /100 | #127 | Exceptional 48.5% |