Uruguayan vs Immigrants from Afghanistan 4th Grade
COMPARE
Uruguayan
Immigrants from Afghanistan
4th Grade
4th Grade Comparison
Uruguayans
Immigrants from Afghanistan
97.2%
4TH GRADE
3.5/ 100
METRIC RATING
230th/ 347
METRIC RANK
96.8%
4TH GRADE
0.0/ 100
METRIC RATING
288th/ 347
METRIC RANK
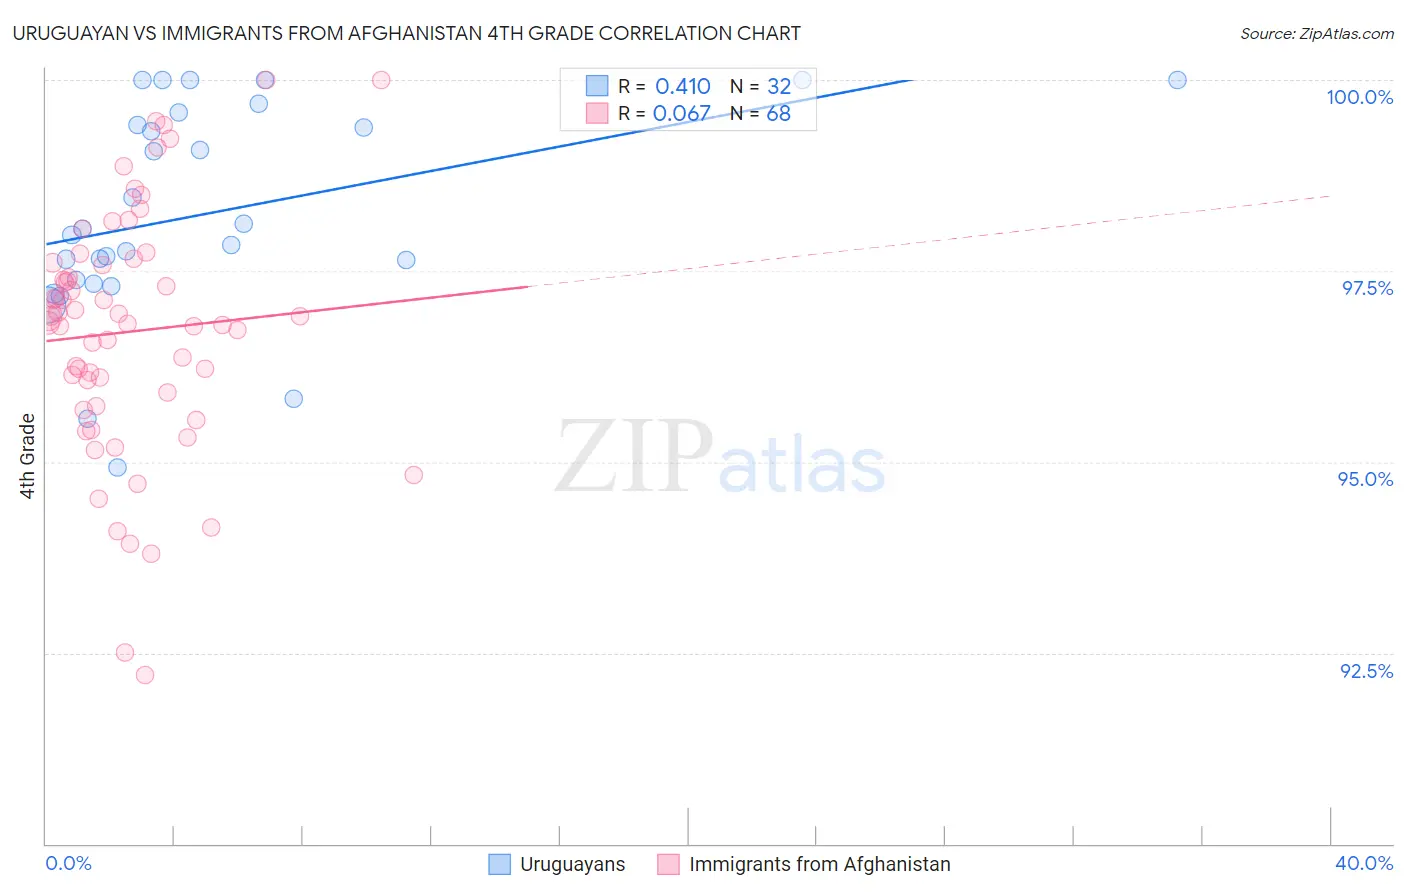
Uruguayan vs Immigrants from Afghanistan 4th Grade Correlation Chart
The statistical analysis conducted on geographies consisting of 144,782,794 people shows a moderate positive correlation between the proportion of Uruguayans and percentage of population with at least 4th grade education in the United States with a correlation coefficient (R) of 0.410 and weighted average of 97.2%. Similarly, the statistical analysis conducted on geographies consisting of 147,629,924 people shows a slight positive correlation between the proportion of Immigrants from Afghanistan and percentage of population with at least 4th grade education in the United States with a correlation coefficient (R) of 0.067 and weighted average of 96.8%, a difference of 0.46%.
4th Grade Correlation Summary
| Measurement | Uruguayan | Immigrants from Afghanistan |
| Minimum | 94.9% | 92.2% |
| Maximum | 100.0% | 100.0% |
| Range | 5.1% | 7.8% |
| Mean | 98.3% | 96.7% |
| Median | 98.0% | 96.9% |
| Interquartile 25% (IQ1) | 97.4% | 95.8% |
| Interquartile 75% (IQ3) | 99.5% | 97.6% |
| Interquartile Range (IQR) | 2.1% | 1.8% |
| Standard Deviation (Sample) | 1.4% | 1.6% |
| Standard Deviation (Population) | 1.4% | 1.6% |
Similar Demographics by 4th Grade
Demographics Similar to Uruguayans by 4th Grade
In terms of 4th grade, the demographic groups most similar to Uruguayans are Subsaharan African (97.2%, a difference of 0.0%), Liberian (97.2%, a difference of 0.0%), Immigrants from Malaysia (97.2%, a difference of 0.0%), Immigrants from Western Asia (97.2%, a difference of 0.0%), and Bahamian (97.2%, a difference of 0.010%).
| Demographics | Rating | Rank | 4th Grade |
| Immigrants | Sudan | 5.0 /100 | #223 | Tragic 97.2% |
| Immigrants | Syria | 5.0 /100 | #224 | Tragic 97.2% |
| Immigrants | Iraq | 4.6 /100 | #225 | Tragic 97.2% |
| Bahamians | 3.8 /100 | #226 | Tragic 97.2% |
| Immigrants | Pakistan | 3.7 /100 | #227 | Tragic 97.2% |
| Sub-Saharan Africans | 3.6 /100 | #228 | Tragic 97.2% |
| Liberians | 3.6 /100 | #229 | Tragic 97.2% |
| Uruguayans | 3.5 /100 | #230 | Tragic 97.2% |
| Immigrants | Malaysia | 3.4 /100 | #231 | Tragic 97.2% |
| Immigrants | Western Asia | 3.4 /100 | #232 | Tragic 97.2% |
| Senegalese | 3.1 /100 | #233 | Tragic 97.2% |
| Assyrians/Chaldeans/Syriacs | 3.0 /100 | #234 | Tragic 97.2% |
| Yuman | 2.9 /100 | #235 | Tragic 97.2% |
| Immigrants | Eastern Asia | 2.7 /100 | #236 | Tragic 97.2% |
| Immigrants | Costa Rica | 2.0 /100 | #237 | Tragic 97.2% |
Demographics Similar to Immigrants from Afghanistan by 4th Grade
In terms of 4th grade, the demographic groups most similar to Immigrants from Afghanistan are Houma (96.8%, a difference of 0.0%), Immigrants from West Indies (96.7%, a difference of 0.020%), British West Indian (96.7%, a difference of 0.030%), Immigrants from Barbados (96.8%, a difference of 0.040%), and Immigrants from Thailand (96.8%, a difference of 0.040%).
| Demographics | Rating | Rank | 4th Grade |
| Immigrants | Hong Kong | 0.1 /100 | #281 | Tragic 96.9% |
| Immigrants | Trinidad and Tobago | 0.1 /100 | #282 | Tragic 96.8% |
| Immigrants | Philippines | 0.1 /100 | #283 | Tragic 96.8% |
| Immigrants | St. Vincent and the Grenadines | 0.1 /100 | #284 | Tragic 96.8% |
| Immigrants | Barbados | 0.0 /100 | #285 | Tragic 96.8% |
| Immigrants | Thailand | 0.0 /100 | #286 | Tragic 96.8% |
| Houma | 0.0 /100 | #287 | Tragic 96.8% |
| Immigrants | Afghanistan | 0.0 /100 | #288 | Tragic 96.8% |
| Immigrants | West Indies | 0.0 /100 | #289 | Tragic 96.7% |
| British West Indians | 0.0 /100 | #290 | Tragic 96.7% |
| Immigrants | Grenada | 0.0 /100 | #291 | Tragic 96.7% |
| Malaysians | 0.0 /100 | #292 | Tragic 96.7% |
| Puerto Ricans | 0.0 /100 | #293 | Tragic 96.7% |
| Immigrants | Eritrea | 0.0 /100 | #294 | Tragic 96.7% |
| Immigrants | Portugal | 0.0 /100 | #295 | Tragic 96.6% |