Uruguayan vs Central American Indian 4th Grade
COMPARE
Uruguayan
Central American Indian
4th Grade
4th Grade Comparison
Uruguayans
Central American Indians
97.2%
4TH GRADE
3.5/ 100
METRIC RATING
230th/ 347
METRIC RANK
96.2%
4TH GRADE
0.0/ 100
METRIC RATING
317th/ 347
METRIC RANK
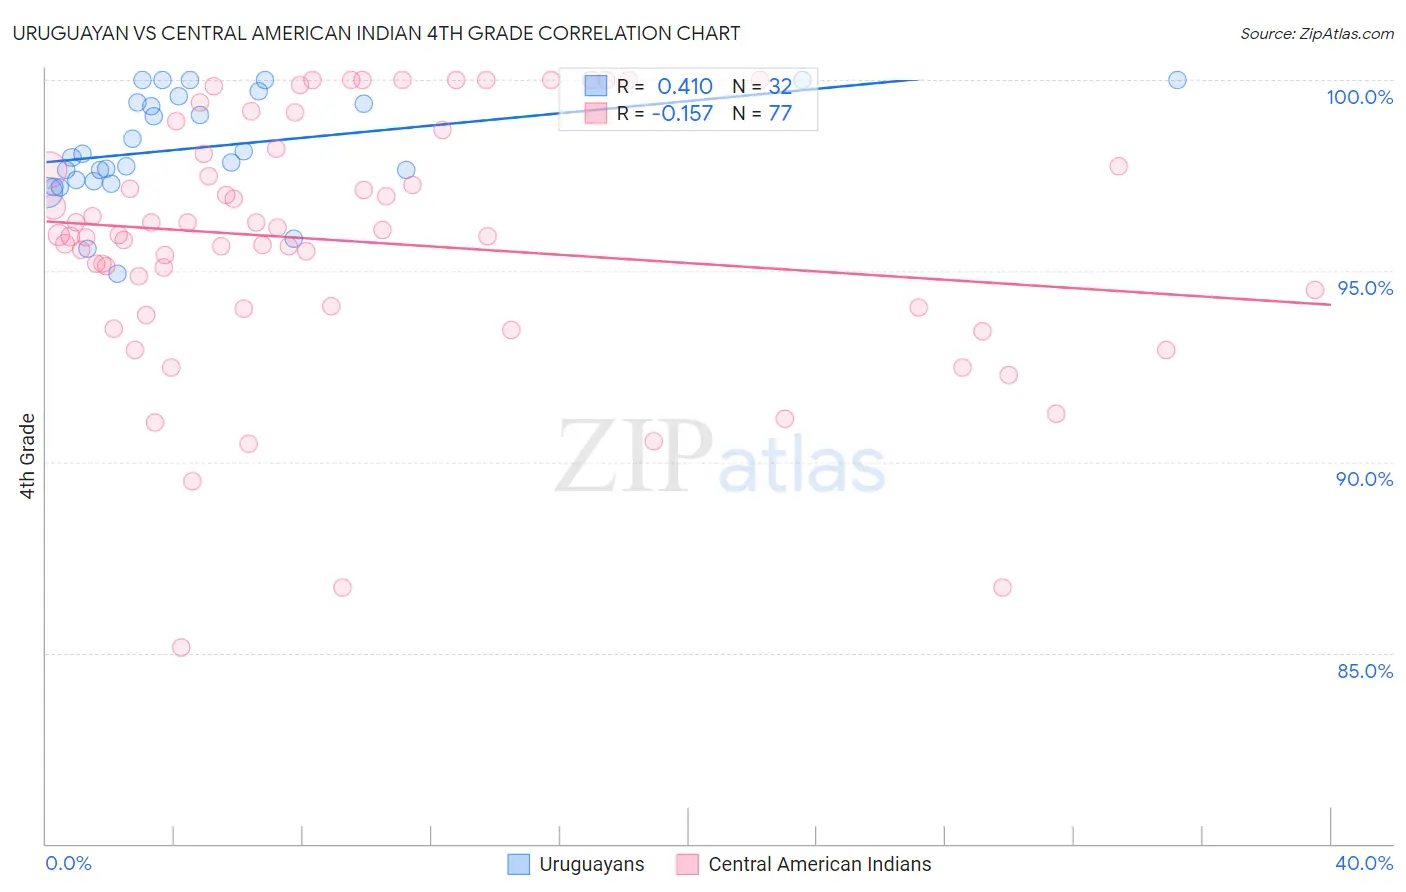
Uruguayan vs Central American Indian 4th Grade Correlation Chart
The statistical analysis conducted on geographies consisting of 144,782,794 people shows a moderate positive correlation between the proportion of Uruguayans and percentage of population with at least 4th grade education in the United States with a correlation coefficient (R) of 0.410 and weighted average of 97.2%. Similarly, the statistical analysis conducted on geographies consisting of 326,140,921 people shows a poor negative correlation between the proportion of Central American Indians and percentage of population with at least 4th grade education in the United States with a correlation coefficient (R) of -0.157 and weighted average of 96.2%, a difference of 1.1%.
4th Grade Correlation Summary
| Measurement | Uruguayan | Central American Indian |
| Minimum | 94.9% | 85.1% |
| Maximum | 100.0% | 100.0% |
| Range | 5.1% | 14.9% |
| Mean | 98.3% | 95.8% |
| Median | 98.0% | 95.9% |
| Interquartile 25% (IQ1) | 97.4% | 94.0% |
| Interquartile 75% (IQ3) | 99.5% | 98.1% |
| Interquartile Range (IQR) | 2.1% | 4.1% |
| Standard Deviation (Sample) | 1.4% | 3.3% |
| Standard Deviation (Population) | 1.4% | 3.3% |
Similar Demographics by 4th Grade
Demographics Similar to Uruguayans by 4th Grade
In terms of 4th grade, the demographic groups most similar to Uruguayans are Subsaharan African (97.2%, a difference of 0.0%), Liberian (97.2%, a difference of 0.0%), Immigrants from Malaysia (97.2%, a difference of 0.0%), Immigrants from Western Asia (97.2%, a difference of 0.0%), and Bahamian (97.2%, a difference of 0.010%).
| Demographics | Rating | Rank | 4th Grade |
| Immigrants | Sudan | 5.0 /100 | #223 | Tragic 97.2% |
| Immigrants | Syria | 5.0 /100 | #224 | Tragic 97.2% |
| Immigrants | Iraq | 4.6 /100 | #225 | Tragic 97.2% |
| Bahamians | 3.8 /100 | #226 | Tragic 97.2% |
| Immigrants | Pakistan | 3.7 /100 | #227 | Tragic 97.2% |
| Sub-Saharan Africans | 3.6 /100 | #228 | Tragic 97.2% |
| Liberians | 3.6 /100 | #229 | Tragic 97.2% |
| Uruguayans | 3.5 /100 | #230 | Tragic 97.2% |
| Immigrants | Malaysia | 3.4 /100 | #231 | Tragic 97.2% |
| Immigrants | Western Asia | 3.4 /100 | #232 | Tragic 97.2% |
| Senegalese | 3.1 /100 | #233 | Tragic 97.2% |
| Assyrians/Chaldeans/Syriacs | 3.0 /100 | #234 | Tragic 97.2% |
| Yuman | 2.9 /100 | #235 | Tragic 97.2% |
| Immigrants | Eastern Asia | 2.7 /100 | #236 | Tragic 97.2% |
| Immigrants | Costa Rica | 2.0 /100 | #237 | Tragic 97.2% |
Demographics Similar to Central American Indians by 4th Grade
In terms of 4th grade, the demographic groups most similar to Central American Indians are Immigrants from Ecuador (96.2%, a difference of 0.040%), Immigrants from the Azores (96.1%, a difference of 0.040%), Vietnamese (96.2%, a difference of 0.050%), Nicaraguan (96.2%, a difference of 0.050%), and Indonesian (96.2%, a difference of 0.060%).
| Demographics | Rating | Rank | 4th Grade |
| Immigrants | Burma/Myanmar | 0.0 /100 | #310 | Tragic 96.3% |
| Immigrants | Bangladesh | 0.0 /100 | #311 | Tragic 96.2% |
| Cape Verdeans | 0.0 /100 | #312 | Tragic 96.2% |
| Indonesians | 0.0 /100 | #313 | Tragic 96.2% |
| Vietnamese | 0.0 /100 | #314 | Tragic 96.2% |
| Nicaraguans | 0.0 /100 | #315 | Tragic 96.2% |
| Immigrants | Ecuador | 0.0 /100 | #316 | Tragic 96.2% |
| Central American Indians | 0.0 /100 | #317 | Tragic 96.2% |
| Immigrants | Azores | 0.0 /100 | #318 | Tragic 96.1% |
| Belizeans | 0.0 /100 | #319 | Tragic 96.1% |
| Bangladeshis | 0.0 /100 | #320 | Tragic 96.1% |
| Japanese | 0.0 /100 | #321 | Tragic 96.0% |
| Immigrants | Vietnam | 0.0 /100 | #322 | Tragic 96.0% |
| Immigrants | Nicaragua | 0.0 /100 | #323 | Tragic 96.0% |
| Immigrants | Belize | 0.0 /100 | #324 | Tragic 96.0% |