Ugandan vs Nonimmigrants Professional Degree

COMPARE

Ugandan
Race
Ancestry
AfghanAfricanAlaska NativeAlaskan AthabascanAlbanianAleutAlsatianAmericanApacheArabArapahoArgentineanArmenianAssyrian/Chaldean/SyriacAustralianAustrianBahamianBangladeshiBarbadianBasqueBelgianBelizeanBermudanBhutaneseBlackfeetBolivianBrazilianBritishBritish West IndianBulgarianBurmeseCajunCambodianCanadianCape VerdeanCarpatho RusynCelticCentral AmericanCentral American IndianCherokeeCheyenneChickasawChileanChineseChippewaChoctawColombianColvilleComancheCosta RicanCreeCreekCroatianCrowCubanCypriotCzechCzechoslovakianDanishDelawareDominicanDutchDutch West IndianEastern EuropeanEcuadorianEgyptianEnglishEstonianEthiopianEuropeanFijianFilipinoFinnishFrenchFrench American IndianFrench CanadianGermanGerman RussianGhanaianGreekGuamanian/ChamorroGuatemalanGuyaneseHaitianHmongHonduranHopiHoumaHungarianIcelanderIndian (Asian)IndonesianInupiatIranianIraqiIrishIroquoisIsraeliItalianJamaicanJapaneseJordanianKenyanKiowaKoreanLaotianLatvianLebaneseLiberianLithuanianLumbeeLuxembourgerMacedonianMalaysianMalteseMarshalleseMenomineeMexicanMexican American IndianMongolianMoroccanNative HawaiianNavajoNepaleseNew ZealanderNicaraguanNigerianNorthern EuropeanNorwegianOkinawanOsageOttawaPaiutePakistaniPalestinianPanamanianParaguayanPennsylvania GermanPeruvianPimaPolishPortuguesePotawatomiPuebloPuerto RicanPuget Sound SalishRomanianRussianSalvadoranSamoanScandinavianScotch-IrishScottishSeminoleSenegaleseSerbianShoshoneSierra LeoneanSiouxSlavicSlovakSloveneSomaliSouth AfricanSouth AmericanSouth American IndianSoviet UnionSpaniardSpanishSpanish AmericanSpanish American IndianSri LankanSubsaharan AfricanSudaneseSwedishSwissSyrianTaiwaneseThaiTlingit-HaidaTohono O'OdhamTonganTrinidadian and TobagonianTsimshianTurkishU.S. Virgin IslanderUgandanUkrainianUruguayanUteVenezuelanVietnameseWelshWest IndianYakamaYaquiYugoslavianYumanYup'ikZimbabwean
Immigration
ImmigrantsAfghanistanAfricaAlbaniaArgentinaArmeniaAsiaAustraliaAustriaBahamasBangladeshBarbadosBelarusBelgiumBelizeBoliviaBosnia and HerzegovinaBrazilBulgariaBurma/MyanmarCabo VerdeCambodiaCameroonCanadaCaribbeanCentral AmericaChileChinaColombiaCongoCosta RicaCroatiaCubaCzechoslovakiaDenmarkDominicaDominican RepublicEastern AfricaEastern AsiaEastern EuropeEcuadorEgyptEl SalvadorEnglandEritreaEthiopiaEuropeFijiFranceGermanyGhanaGreeceGrenadaGuatemalaGuyanaHaitiHondurasHong KongHungaryIndiaIndonesiaIranIraqIrelandIsraelItalyJamaicaJapanJordanKazakhstanKenyaKoreaKuwaitLaosLatin AmericaLatviaLebanonLiberiaLithuaniaMalaysiaMexicoMicronesiaMiddle AfricaMoldovaMoroccoNepalNetherlandsNicaraguaNigeriaNorth AmericaNorth MacedoniaNorthern AfricaNorthern EuropeNorwayOceaniaPakistanPanamaPeruPhilippinesPolandPortugalRomaniaRussiaSaudi ArabiaScotlandSenegalSerbiaSierra LeoneSingaporeSomaliaSouth AfricaSouth AmericaSouth Central AsiaSouth Eastern AsiaSouthern EuropeSpainSri LankaSt. Vincent and the GrenadinesSudanSwedenSwitzerlandSyriaTaiwanThailandTrinidad and TobagoTurkeyUgandaUkraineUruguayUzbekistanVenezuelaVietnamWest IndiesWestern AfricaWestern AsiaWestern EuropeYemenZaireZimbabweAzores
Nonimmigrants
Race
Ancestry
AfghanAfricanAlaska NativeAlaskan AthabascanAlbanianAleutAlsatianAmericanApacheArabArapahoArgentineanArmenianAssyrian/Chaldean/SyriacAustralianAustrianBahamianBangladeshiBarbadianBasqueBelgianBelizeanBermudanBhutaneseBlackfeetBolivianBrazilianBritishBritish West IndianBulgarianBurmeseCajunCambodianCanadianCape VerdeanCarpatho RusynCelticCentral AmericanCentral American IndianCherokeeCheyenneChickasawChileanChineseChippewaChoctawColombianColvilleComancheCosta RicanCreeCreekCroatianCrowCubanCypriotCzechCzechoslovakianDanishDelawareDominicanDutchDutch West IndianEastern EuropeanEcuadorianEgyptianEnglishEstonianEthiopianEuropeanFijianFilipinoFinnishFrenchFrench American IndianFrench CanadianGermanGerman RussianGhanaianGreekGuamanian/ChamorroGuatemalanGuyaneseHaitianHmongHonduranHopiHoumaHungarianIcelanderIndian (Asian)IndonesianInupiatIranianIraqiIrishIroquoisIsraeliItalianJamaicanJapaneseJordanianKenyanKiowaKoreanLaotianLatvianLebaneseLiberianLithuanianLumbeeLuxembourgerMacedonianMalaysianMalteseMarshalleseMenomineeMexicanMexican American IndianMongolianMoroccanNative HawaiianNavajoNepaleseNew ZealanderNicaraguanNigerianNorthern EuropeanNorwegianOkinawanOsageOttawaPaiutePakistaniPalestinianPanamanianParaguayanPennsylvania GermanPeruvianPimaPolishPortuguesePotawatomiPuebloPuerto RicanPuget Sound SalishRomanianRussianSalvadoranSamoanScandinavianScotch-IrishScottishSeminoleSenegaleseSerbianShoshoneSierra LeoneanSiouxSlavicSlovakSloveneSomaliSouth AfricanSouth AmericanSouth American IndianSoviet UnionSpaniardSpanishSpanish AmericanSpanish American IndianSri LankanSubsaharan AfricanSudaneseSwedishSwissSyrianTaiwaneseThaiTlingit-HaidaTohono O'OdhamTonganTrinidadian and TobagonianTsimshianTurkishU.S. Virgin IslanderUkrainianUruguayanUteVenezuelanVietnameseWelshWest IndianYakamaYaquiYugoslavianYumanYup'ikZimbabwean
Immigration
NonimmigrantsImmigrantsAfghanistanAfricaAlbaniaArgentinaArmeniaAsiaAustraliaAustriaBahamasBangladeshBarbadosBelarusBelgiumBelizeBoliviaBosnia and HerzegovinaBrazilBulgariaBurma/MyanmarCabo VerdeCambodiaCameroonCanadaCaribbeanCentral AmericaChileChinaColombiaCongoCosta RicaCroatiaCubaCzechoslovakiaDenmarkDominicaDominican RepublicEastern AfricaEastern AsiaEastern EuropeEcuadorEgyptEl SalvadorEnglandEritreaEthiopiaEuropeFijiFranceGermanyGhanaGreeceGrenadaGuatemalaGuyanaHaitiHondurasHong KongHungaryIndiaIndonesiaIranIraqIrelandIsraelItalyJamaicaJapanJordanKazakhstanKenyaKoreaKuwaitLaosLatin AmericaLatviaLebanonLiberiaLithuaniaMalaysiaMexicoMicronesiaMiddle AfricaMoldovaMoroccoNepalNetherlandsNicaraguaNigeriaNorth AmericaNorth MacedoniaNorthern AfricaNorthern EuropeNorwayOceaniaPakistanPanamaPeruPhilippinesPolandPortugalRomaniaRussiaSaudi ArabiaScotlandSenegalSerbiaSierra LeoneSingaporeSomaliaSouth AfricaSouth AmericaSouth Central AsiaSouth Eastern AsiaSouthern EuropeSpainSri LankaSt. Vincent and the GrenadinesSudanSwedenSwitzerlandSyriaTaiwanThailandTrinidad and TobagoTurkeyUgandaUkraineUruguayUzbekistanVenezuelaVietnamWest IndiesWestern AfricaWestern AsiaWestern EuropeYemenZaireZimbabweAzores
Professional Degree
Income
Poverty
Unemployment
Labor Participation
Family Structure
Vehicle Availability
Education Level
Disability

Professional Degree Comparison

Ugandans

Nonimmigrants

Exceptional
Tragic
5.1%
PROFESSIONAL DEGREE
98.8/ 100
METRIC RATING
100th/ 347
METRIC RANK
3.9%
PROFESSIONAL DEGREE
4.0/ 100
METRIC RATING
234th/ 347
METRIC RANK

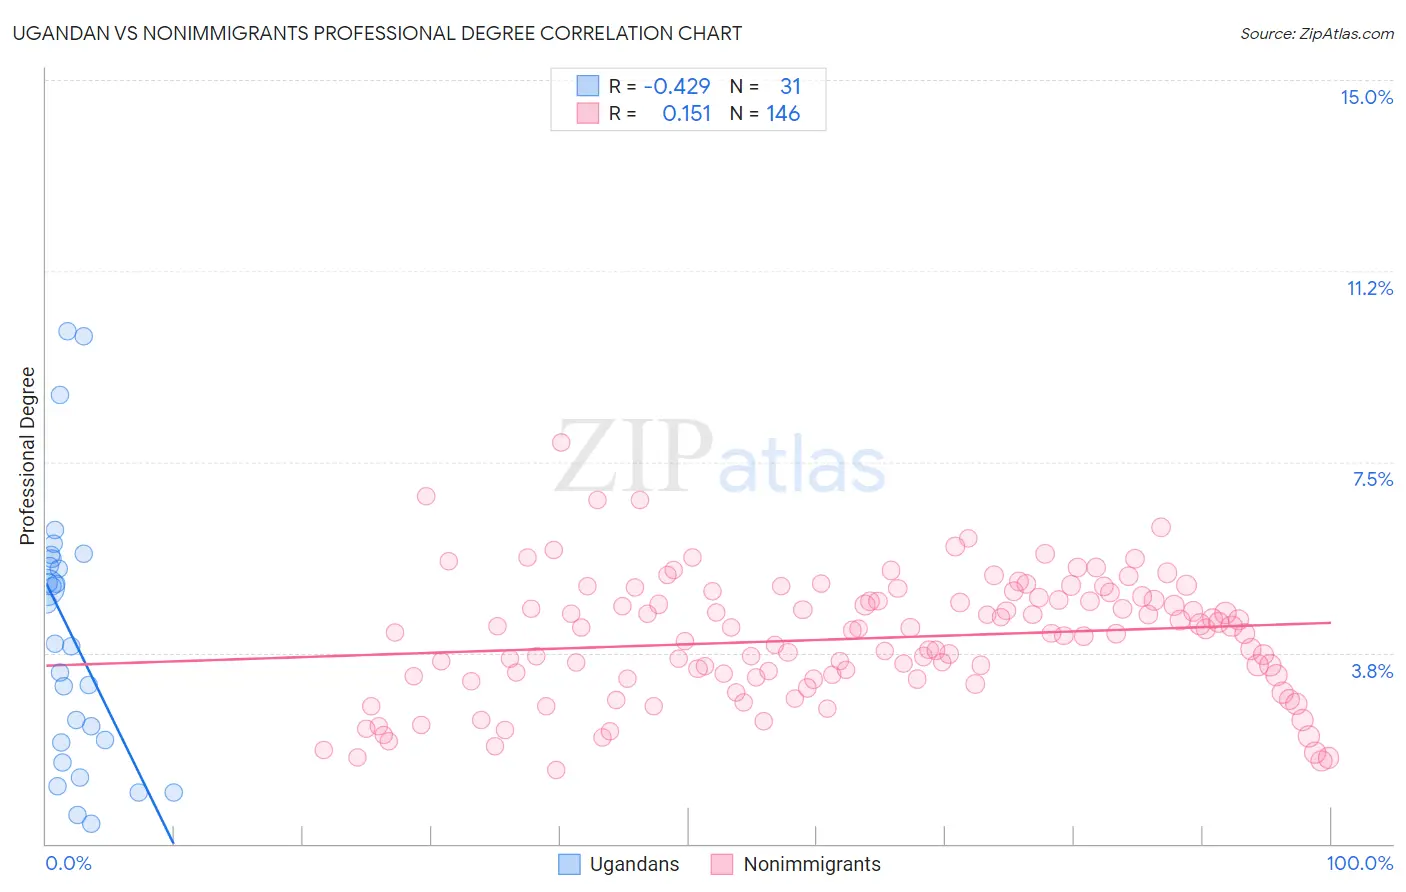
Ugandan vs Nonimmigrants Professional Degree Correlation Chart

The statistical analysis conducted on geographies consisting of 93,981,800 people shows a moderate negative correlation between the proportion of Ugandans and percentage of population with at least professional degree education in the United States with a correlation coefficient (R) of -0.429 and weighted average of 5.1%. Similarly, the statistical analysis conducted on geographies consisting of 572,440,292 people shows a poor positive correlation between the proportion of Nonimmigrants and percentage of population with at least professional degree education in the United States with a correlation coefficient (R) of 0.151 and weighted average of 3.9%, a difference of 31.2%.
Ugandan vs Nonimmigrants Professional Degree

Professional Degree Correlation Summary

MeasurementUgandanNonimmigrants
Minimum0.38%1.4%
Maximum10.1%7.9%
Range9.7%6.4%
Mean4.1%4.0%
Median3.9%4.1%
Interquartile 25% (IQ1)2.0%3.3%
Interquartile 75% (IQ3)5.6%4.8%
Interquartile Range (IQR)3.6%1.5%
Standard Deviation (Sample)2.6%1.2%
Standard Deviation (Population)2.5%1.2%

Similar Demographics by Professional Degree

Demographics Similar to Ugandans by Professional Degree

In terms of professional degree, the demographic groups most similar to Ugandans are Immigrants from Egypt (5.1%, a difference of 0.75%), Immigrants from Italy (5.2%, a difference of 0.76%), Austrian (5.2%, a difference of 0.82%), Ukrainian (5.1%, a difference of 0.83%), and Syrian (5.2%, a difference of 0.85%).
DemographicsRating | RankProfessional Degree
Northern Europeans
99.3
/100
|
#93
Exceptional
5.2%
Alsatians
99.3
/100
|
#94
Exceptional
5.2%
Zimbabweans
99.3
/100
|
#95
Exceptional
5.2%
Immigrants | Uzbekistan
99.2
/100
|
#96
Exceptional
5.2%
Syrians
99.1
/100
|
#97
Exceptional
5.2%
Austrians
99.1
/100
|
#98
Exceptional
5.2%
Immigrants | Italy
99.1
/100
|
#99
Exceptional
5.2%
Ugandans
98.8
/100
|
#100
Exceptional
5.1%
Immigrants | Egypt
98.5
/100
|
#101
Exceptional
5.1%
Ukrainians
98.5
/100
|
#102
Exceptional
5.1%
Immigrants | Northern Africa
98.4
/100
|
#103
Exceptional
5.1%
Arabs
98.2
/100
|
#104
Exceptional
5.0%
Immigrants | Uganda
98.2
/100
|
#105
Exceptional
5.0%
Immigrants | Ukraine
98.2
/100
|
#106
Exceptional
5.0%
Maltese
98.1
/100
|
#107
Exceptional
5.0%

Demographics Similar to Nonimmigrants by Professional Degree

In terms of professional degree, the demographic groups most similar to Nonimmigrants are Immigrants from Barbados (3.9%, a difference of 0.010%), Immigrants from Philippines (3.9%, a difference of 0.050%), Spanish American (3.9%, a difference of 0.23%), Cree (3.9%, a difference of 0.30%), and Immigrants from Trinidad and Tobago (3.9%, a difference of 0.30%).
DemographicsRating | RankProfessional Degree
Cubans
5.9
/100
|
#227
Tragic
4.0%
Immigrants | West Indies
5.6
/100
|
#228
Tragic
4.0%
Immigrants | Burma/Myanmar
5.4
/100
|
#229
Tragic
3.9%
Nicaraguans
5.1
/100
|
#230
Tragic
3.9%
Ecuadorians
4.6
/100
|
#231
Tragic
3.9%
Cree
4.3
/100
|
#232
Tragic
3.9%
Immigrants | Philippines
4.1
/100
|
#233
Tragic
3.9%
Immigrants | Nonimmigrants
4.0
/100
|
#234
Tragic
3.9%
Immigrants | Barbados
4.0
/100
|
#235
Tragic
3.9%
Spanish Americans
3.8
/100
|
#236
Tragic
3.9%
Immigrants | Trinidad and Tobago
3.8
/100
|
#237
Tragic
3.9%
Colville
2.6
/100
|
#238
Tragic
3.8%
British West Indians
2.4
/100
|
#239
Tragic
3.8%
Immigrants | Ecuador
2.3
/100
|
#240
Tragic
3.8%
Alaskan Athabascans
2.3
/100
|
#241
Tragic
3.8%