Ugandan vs Immigrants from Taiwan Professional Degree
COMPARE
Ugandan
Immigrants from Taiwan
Professional Degree
Professional Degree Comparison
Ugandans
Immigrants from Taiwan
5.1%
PROFESSIONAL DEGREE
98.8/ 100
METRIC RATING
100th/ 347
METRIC RANK
7.1%
PROFESSIONAL DEGREE
100.0/ 100
METRIC RATING
9th/ 347
METRIC RANK
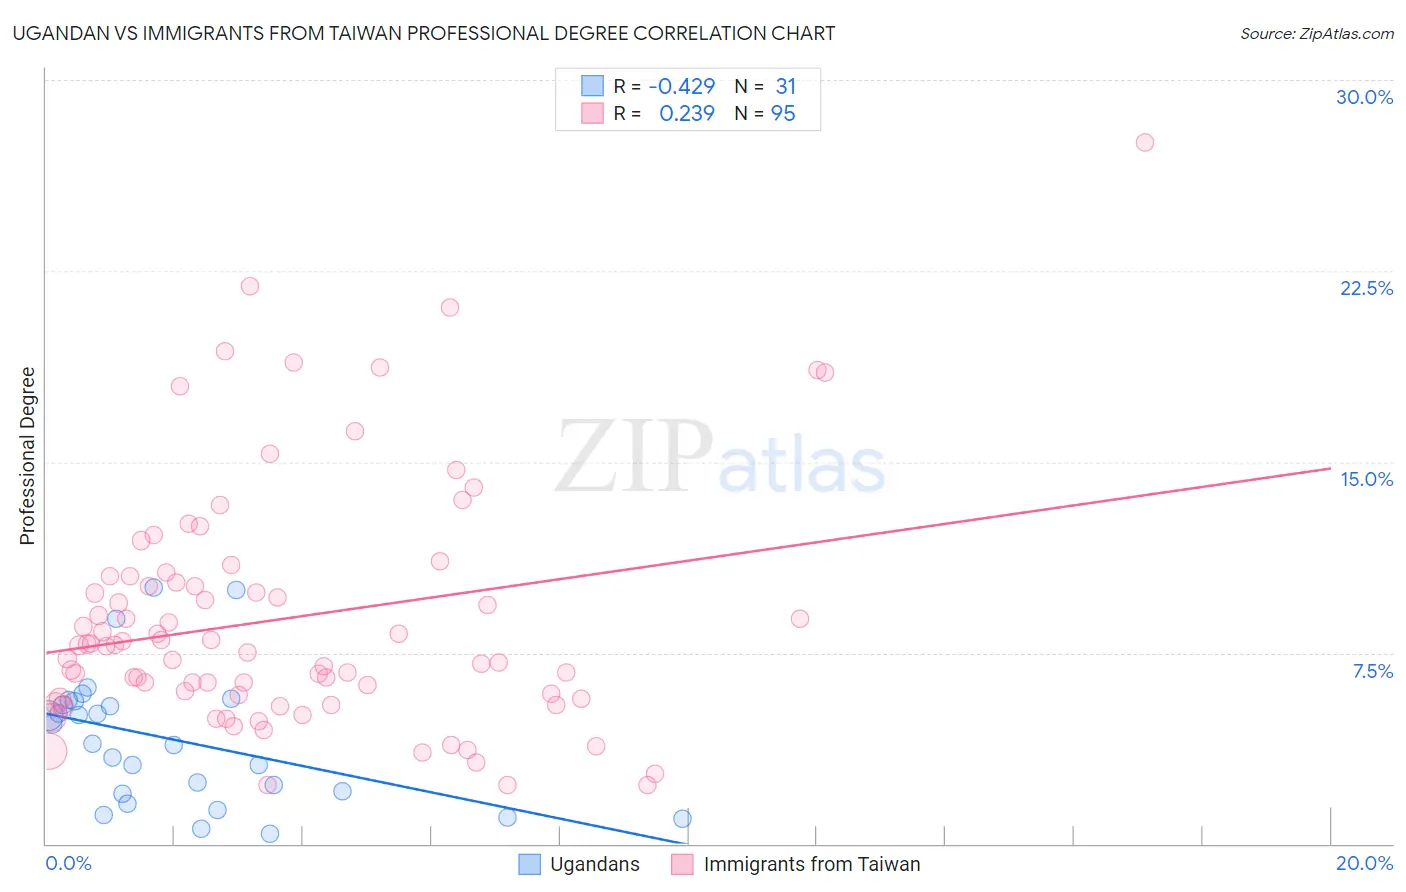
Ugandan vs Immigrants from Taiwan Professional Degree Correlation Chart
The statistical analysis conducted on geographies consisting of 93,981,800 people shows a moderate negative correlation between the proportion of Ugandans and percentage of population with at least professional degree education in the United States with a correlation coefficient (R) of -0.429 and weighted average of 5.1%. Similarly, the statistical analysis conducted on geographies consisting of 298,058,509 people shows a weak positive correlation between the proportion of Immigrants from Taiwan and percentage of population with at least professional degree education in the United States with a correlation coefficient (R) of 0.239 and weighted average of 7.1%, a difference of 38.2%.
Professional Degree Correlation Summary
| Measurement | Ugandan | Immigrants from Taiwan |
| Minimum | 0.38% | 2.3% |
| Maximum | 10.1% | 27.6% |
| Range | 9.7% | 25.2% |
| Mean | 4.1% | 8.9% |
| Median | 3.9% | 7.8% |
| Interquartile 25% (IQ1) | 2.0% | 5.7% |
| Interquartile 75% (IQ3) | 5.6% | 10.5% |
| Interquartile Range (IQR) | 3.6% | 4.8% |
| Standard Deviation (Sample) | 2.6% | 4.8% |
| Standard Deviation (Population) | 2.5% | 4.8% |
Similar Demographics by Professional Degree
Demographics Similar to Ugandans by Professional Degree
In terms of professional degree, the demographic groups most similar to Ugandans are Immigrants from Egypt (5.1%, a difference of 0.75%), Immigrants from Italy (5.2%, a difference of 0.76%), Austrian (5.2%, a difference of 0.82%), Ukrainian (5.1%, a difference of 0.83%), and Syrian (5.2%, a difference of 0.85%).
| Demographics | Rating | Rank | Professional Degree |
| Northern Europeans | 99.3 /100 | #93 | Exceptional 5.2% |
| Alsatians | 99.3 /100 | #94 | Exceptional 5.2% |
| Zimbabweans | 99.3 /100 | #95 | Exceptional 5.2% |
| Immigrants | Uzbekistan | 99.2 /100 | #96 | Exceptional 5.2% |
| Syrians | 99.1 /100 | #97 | Exceptional 5.2% |
| Austrians | 99.1 /100 | #98 | Exceptional 5.2% |
| Immigrants | Italy | 99.1 /100 | #99 | Exceptional 5.2% |
| Ugandans | 98.8 /100 | #100 | Exceptional 5.1% |
| Immigrants | Egypt | 98.5 /100 | #101 | Exceptional 5.1% |
| Ukrainians | 98.5 /100 | #102 | Exceptional 5.1% |
| Immigrants | Northern Africa | 98.4 /100 | #103 | Exceptional 5.1% |
| Arabs | 98.2 /100 | #104 | Exceptional 5.0% |
| Immigrants | Uganda | 98.2 /100 | #105 | Exceptional 5.0% |
| Immigrants | Ukraine | 98.2 /100 | #106 | Exceptional 5.0% |
| Maltese | 98.1 /100 | #107 | Exceptional 5.0% |
Demographics Similar to Immigrants from Taiwan by Professional Degree
In terms of professional degree, the demographic groups most similar to Immigrants from Taiwan are Immigrants from Switzerland (7.1%, a difference of 0.19%), Eastern European (7.1%, a difference of 0.33%), Immigrants from Belgium (7.0%, a difference of 1.7%), Cypriot (6.9%, a difference of 1.9%), and Israeli (6.9%, a difference of 2.0%).
| Demographics | Rating | Rank | Professional Degree |
| Immigrants | Singapore | 100.0 /100 | #2 | Exceptional 7.7% |
| Iranians | 100.0 /100 | #3 | Exceptional 7.6% |
| Filipinos | 100.0 /100 | #4 | Exceptional 7.6% |
| Immigrants | Iran | 100.0 /100 | #5 | Exceptional 7.3% |
| Okinawans | 100.0 /100 | #6 | Exceptional 7.3% |
| Eastern Europeans | 100.0 /100 | #7 | Exceptional 7.1% |
| Immigrants | Switzerland | 100.0 /100 | #8 | Exceptional 7.1% |
| Immigrants | Taiwan | 100.0 /100 | #9 | Exceptional 7.1% |
| Immigrants | Belgium | 100.0 /100 | #10 | Exceptional 7.0% |
| Cypriots | 100.0 /100 | #11 | Exceptional 6.9% |
| Israelis | 100.0 /100 | #12 | Exceptional 6.9% |
| Immigrants | Australia | 100.0 /100 | #13 | Exceptional 6.9% |
| Immigrants | France | 100.0 /100 | #14 | Exceptional 6.8% |
| Immigrants | China | 100.0 /100 | #15 | Exceptional 6.7% |
| Immigrants | Sweden | 100.0 /100 | #16 | Exceptional 6.7% |