Ugandan vs Immigrants from Sweden 10th Grade

COMPARE

Ugandan
Race
Ancestry
AfghanAfricanAlaska NativeAlaskan AthabascanAlbanianAleutAlsatianAmericanApacheArabArapahoArgentineanArmenianAssyrian/Chaldean/SyriacAustralianAustrianBahamianBangladeshiBarbadianBasqueBelgianBelizeanBermudanBhutaneseBlackfeetBolivianBrazilianBritishBritish West IndianBulgarianBurmeseCajunCambodianCanadianCape VerdeanCarpatho RusynCelticCentral AmericanCentral American IndianCherokeeCheyenneChickasawChileanChineseChippewaChoctawColombianColvilleComancheCosta RicanCreeCreekCroatianCrowCubanCypriotCzechCzechoslovakianDanishDelawareDominicanDutchDutch West IndianEastern EuropeanEcuadorianEgyptianEnglishEstonianEthiopianEuropeanFijianFilipinoFinnishFrenchFrench American IndianFrench CanadianGermanGerman RussianGhanaianGreekGuamanian/ChamorroGuatemalanGuyaneseHaitianHmongHonduranHopiHoumaHungarianIcelanderIndian (Asian)IndonesianInupiatIranianIraqiIrishIroquoisIsraeliItalianJamaicanJapaneseJordanianKenyanKiowaKoreanLaotianLatvianLebaneseLiberianLithuanianLumbeeLuxembourgerMacedonianMalaysianMalteseMarshalleseMenomineeMexicanMexican American IndianMongolianMoroccanNative HawaiianNavajoNepaleseNew ZealanderNicaraguanNigerianNorthern EuropeanNorwegianOkinawanOsageOttawaPaiutePakistaniPalestinianPanamanianParaguayanPennsylvania GermanPeruvianPimaPolishPortuguesePotawatomiPuebloPuerto RicanPuget Sound SalishRomanianRussianSalvadoranSamoanScandinavianScotch-IrishScottishSeminoleSenegaleseSerbianShoshoneSierra LeoneanSiouxSlavicSlovakSloveneSomaliSouth AfricanSouth AmericanSouth American IndianSoviet UnionSpaniardSpanishSpanish AmericanSpanish American IndianSri LankanSubsaharan AfricanSudaneseSwedishSwissSyrianTaiwaneseThaiTlingit-HaidaTohono O'OdhamTonganTrinidadian and TobagonianTsimshianTurkishU.S. Virgin IslanderUgandanUkrainianUruguayanUteVenezuelanVietnameseWelshWest IndianYakamaYaquiYugoslavianYumanYup'ikZimbabwean
Immigration
NonimmigrantsImmigrantsAfghanistanAfricaAlbaniaArgentinaArmeniaAsiaAustraliaAustriaBahamasBangladeshBarbadosBelarusBelgiumBelizeBoliviaBosnia and HerzegovinaBrazilBulgariaBurma/MyanmarCabo VerdeCambodiaCameroonCanadaCaribbeanCentral AmericaChileChinaColombiaCongoCosta RicaCroatiaCubaCzechoslovakiaDenmarkDominicaDominican RepublicEastern AfricaEastern AsiaEastern EuropeEcuadorEgyptEl SalvadorEnglandEritreaEthiopiaEuropeFijiFranceGermanyGhanaGreeceGrenadaGuatemalaGuyanaHaitiHondurasHong KongHungaryIndiaIndonesiaIranIraqIrelandIsraelItalyJamaicaJapanJordanKazakhstanKenyaKoreaKuwaitLaosLatin AmericaLatviaLebanonLiberiaLithuaniaMalaysiaMexicoMicronesiaMiddle AfricaMoldovaMoroccoNepalNetherlandsNicaraguaNigeriaNorth AmericaNorth MacedoniaNorthern AfricaNorthern EuropeNorwayOceaniaPakistanPanamaPeruPhilippinesPolandPortugalRomaniaRussiaSaudi ArabiaScotlandSenegalSerbiaSierra LeoneSingaporeSomaliaSouth AfricaSouth AmericaSouth Central AsiaSouth Eastern AsiaSouthern EuropeSpainSri LankaSt. Vincent and the GrenadinesSudanSwitzerlandSyriaTaiwanThailandTrinidad and TobagoTurkeyUgandaUkraineUruguayUzbekistanVenezuelaVietnamWest IndiesWestern AfricaWestern AsiaWestern EuropeYemenZaireZimbabweAzores
Immigrants from Sweden
Race
Ancestry
AfghanAfricanAlaska NativeAlaskan AthabascanAlbanianAleutAlsatianAmericanApacheArabArapahoArgentineanArmenianAssyrian/Chaldean/SyriacAustralianAustrianBahamianBangladeshiBarbadianBasqueBelgianBelizeanBermudanBhutaneseBlackfeetBolivianBrazilianBritishBritish West IndianBulgarianBurmeseCajunCambodianCanadianCape VerdeanCarpatho RusynCelticCentral AmericanCentral American IndianCherokeeCheyenneChickasawChileanChineseChippewaChoctawColombianColvilleComancheCosta RicanCreeCreekCroatianCrowCubanCypriotCzechCzechoslovakianDanishDelawareDominicanDutchDutch West IndianEastern EuropeanEcuadorianEgyptianEnglishEstonianEthiopianEuropeanFijianFilipinoFinnishFrenchFrench American IndianFrench CanadianGermanGerman RussianGhanaianGreekGuamanian/ChamorroGuatemalanGuyaneseHaitianHmongHonduranHopiHoumaHungarianIcelanderIndian (Asian)IndonesianInupiatIranianIraqiIrishIroquoisIsraeliItalianJamaicanJapaneseJordanianKenyanKiowaKoreanLaotianLatvianLebaneseLiberianLithuanianLumbeeLuxembourgerMacedonianMalaysianMalteseMarshalleseMenomineeMexicanMexican American IndianMongolianMoroccanNative HawaiianNavajoNepaleseNew ZealanderNicaraguanNigerianNorthern EuropeanNorwegianOkinawanOsageOttawaPaiutePakistaniPalestinianPanamanianParaguayanPennsylvania GermanPeruvianPimaPolishPortuguesePotawatomiPuebloPuerto RicanPuget Sound SalishRomanianRussianSalvadoranSamoanScandinavianScotch-IrishScottishSeminoleSenegaleseSerbianShoshoneSierra LeoneanSiouxSlavicSlovakSloveneSomaliSouth AfricanSouth AmericanSouth American IndianSoviet UnionSpaniardSpanishSpanish AmericanSpanish American IndianSri LankanSubsaharan AfricanSudaneseSwedishSwissSyrianTaiwaneseThaiTlingit-HaidaTohono O'OdhamTonganTrinidadian and TobagonianTsimshianTurkishU.S. Virgin IslanderUkrainianUruguayanUteVenezuelanVietnameseWelshWest IndianYakamaYaquiYugoslavianYumanYup'ikZimbabwean
Immigration
NonimmigrantsImmigrantsAfghanistanAfricaAlbaniaArgentinaArmeniaAsiaAustraliaAustriaBahamasBangladeshBarbadosBelarusBelgiumBelizeBoliviaBosnia and HerzegovinaBrazilBulgariaBurma/MyanmarCabo VerdeCambodiaCameroonCanadaCaribbeanCentral AmericaChileChinaColombiaCongoCosta RicaCroatiaCubaCzechoslovakiaDenmarkDominicaDominican RepublicEastern AfricaEastern AsiaEastern EuropeEcuadorEgyptEl SalvadorEnglandEritreaEthiopiaEuropeFijiFranceGermanyGhanaGreeceGrenadaGuatemalaGuyanaHaitiHondurasHong KongHungaryIndiaIndonesiaIranIraqIrelandIsraelItalyJamaicaJapanJordanKazakhstanKenyaKoreaKuwaitLaosLatin AmericaLatviaLebanonLiberiaLithuaniaMalaysiaMexicoMicronesiaMiddle AfricaMoldovaMoroccoNepalNetherlandsNicaraguaNigeriaNorth AmericaNorth MacedoniaNorthern AfricaNorthern EuropeNorwayOceaniaPakistanPanamaPeruPhilippinesPolandPortugalRomaniaRussiaSaudi ArabiaScotlandSenegalSerbiaSierra LeoneSingaporeSomaliaSouth AfricaSouth AmericaSouth Central AsiaSouth Eastern AsiaSouthern EuropeSpainSri LankaSt. Vincent and the GrenadinesSudanSwedenSwitzerlandSyriaTaiwanThailandTrinidad and TobagoTurkeyUgandaUkraineUruguayUzbekistanVenezuelaVietnamWest IndiesWestern AfricaWestern AsiaWestern EuropeYemenZaireZimbabweAzores
10th Grade
Income
Poverty
Unemployment
Labor Participation
Family Structure
Vehicle Availability
Education Level
Disability

10th Grade Comparison

Ugandans

Immigrants from Sweden

Excellent
Exceptional
94.0%
10TH GRADE
80.7/ 100
METRIC RATING
149th/ 347
METRIC RANK
94.9%
10TH GRADE
99.6/ 100
METRIC RATING
72nd/ 347
METRIC RANK

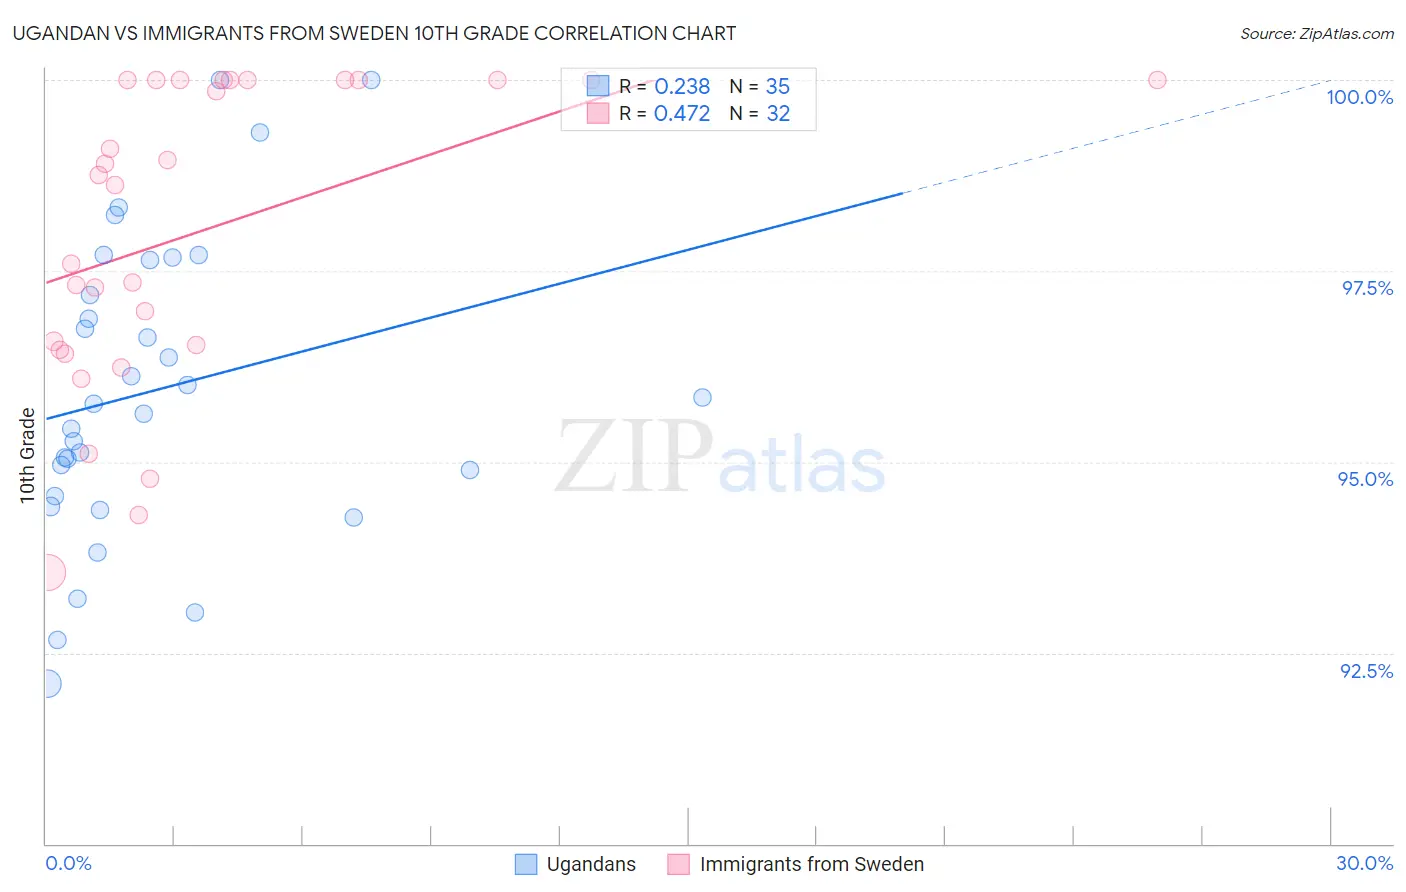
Ugandan vs Immigrants from Sweden 10th Grade Correlation Chart

The statistical analysis conducted on geographies consisting of 93,990,882 people shows a weak positive correlation between the proportion of Ugandans and percentage of population with at least 10th grade education in the United States with a correlation coefficient (R) of 0.238 and weighted average of 94.0%. Similarly, the statistical analysis conducted on geographies consisting of 164,736,894 people shows a moderate positive correlation between the proportion of Immigrants from Sweden and percentage of population with at least 10th grade education in the United States with a correlation coefficient (R) of 0.472 and weighted average of 94.9%, a difference of 0.90%.
Ugandan vs Immigrants from Sweden 10th Grade

10th Grade Correlation Summary

MeasurementUgandanImmigrants from Sweden
Minimum92.1%93.5%
Maximum100.0%100.0%
Range7.9%6.5%
Mean95.9%98.0%
Median95.8%98.7%
Interquartile 25% (IQ1)94.6%96.5%
Interquartile 75% (IQ3)97.6%100.0%
Interquartile Range (IQR)3.1%3.5%
Standard Deviation (Sample)2.0%2.0%
Standard Deviation (Population)1.9%2.0%

Similar Demographics by 10th Grade

Demographics Similar to Ugandans by 10th Grade

In terms of 10th grade, the demographic groups most similar to Ugandans are Arab (94.0%, a difference of 0.0%), Immigrants from Ukraine (94.0%, a difference of 0.010%), Egyptian (94.0%, a difference of 0.020%), Kenyan (94.0%, a difference of 0.020%), and Chickasaw (94.1%, a difference of 0.030%).
DemographicsRating | Rank10th Grade
Albanians
86.5
/100
|
#142
Excellent
94.1%
Cherokee
84.9
/100
|
#143
Excellent
94.1%
Immigrants | Kazakhstan
84.9
/100
|
#144
Excellent
94.1%
Immigrants | Nonimmigrants
83.8
/100
|
#145
Excellent
94.1%
Chickasaw
82.6
/100
|
#146
Excellent
94.1%
Immigrants | Ukraine
81.5
/100
|
#147
Excellent
94.0%
Arabs
80.9
/100
|
#148
Excellent
94.0%
Ugandans
80.7
/100
|
#149
Excellent
94.0%
Egyptians
79.6
/100
|
#150
Good
94.0%
Kenyans
79.1
/100
|
#151
Good
94.0%
Immigrants | Italy
78.0
/100
|
#152
Good
94.0%
Immigrants | Brazil
75.5
/100
|
#153
Good
94.0%
Immigrants | Kenya
75.3
/100
|
#154
Good
94.0%
Spanish
74.9
/100
|
#155
Good
94.0%
Mongolians
74.4
/100
|
#156
Good
94.0%

Demographics Similar to Immigrants from Sweden by 10th Grade

In terms of 10th grade, the demographic groups most similar to Immigrants from Sweden are Bhutanese (94.9%, a difference of 0.010%), Canadian (94.9%, a difference of 0.010%), Zimbabwean (94.9%, a difference of 0.020%), Alaska Native (94.9%, a difference of 0.020%), and Immigrants from England (94.9%, a difference of 0.030%).
DemographicsRating | Rank10th Grade
Turks
99.7
/100
|
#65
Exceptional
95.0%
Immigrants | Australia
99.7
/100
|
#66
Exceptional
94.9%
Immigrants | Netherlands
99.7
/100
|
#67
Exceptional
94.9%
Immigrants | Belgium
99.7
/100
|
#68
Exceptional
94.9%
Immigrants | England
99.6
/100
|
#69
Exceptional
94.9%
Zimbabweans
99.6
/100
|
#70
Exceptional
94.9%
Alaska Natives
99.6
/100
|
#71
Exceptional
94.9%
Immigrants | Sweden
99.6
/100
|
#72
Exceptional
94.9%
Bhutanese
99.6
/100
|
#73
Exceptional
94.9%
Canadians
99.6
/100
|
#74
Exceptional
94.9%
Okinawans
99.5
/100
|
#75
Exceptional
94.8%
Romanians
99.5
/100
|
#76
Exceptional
94.8%
Immigrants | South Africa
99.5
/100
|
#77
Exceptional
94.8%
Filipinos
99.3
/100
|
#78
Exceptional
94.8%
Immigrants | Czechoslovakia
99.2
/100
|
#79
Exceptional
94.7%