Taiwanese vs Immigrants from St. Vincent and the Grenadines GED/Equivalency
COMPARE
Taiwanese
Immigrants from St. Vincent and the Grenadines
GED/Equivalency
GED/Equivalency Comparison
Taiwanese
Immigrants from St. Vincent and the Grenadines
84.7%
GED/EQUIVALENCY
8.1/ 100
METRIC RATING
221st/ 347
METRIC RANK
82.0%
GED/EQUIVALENCY
0.0/ 100
METRIC RATING
294th/ 347
METRIC RANK
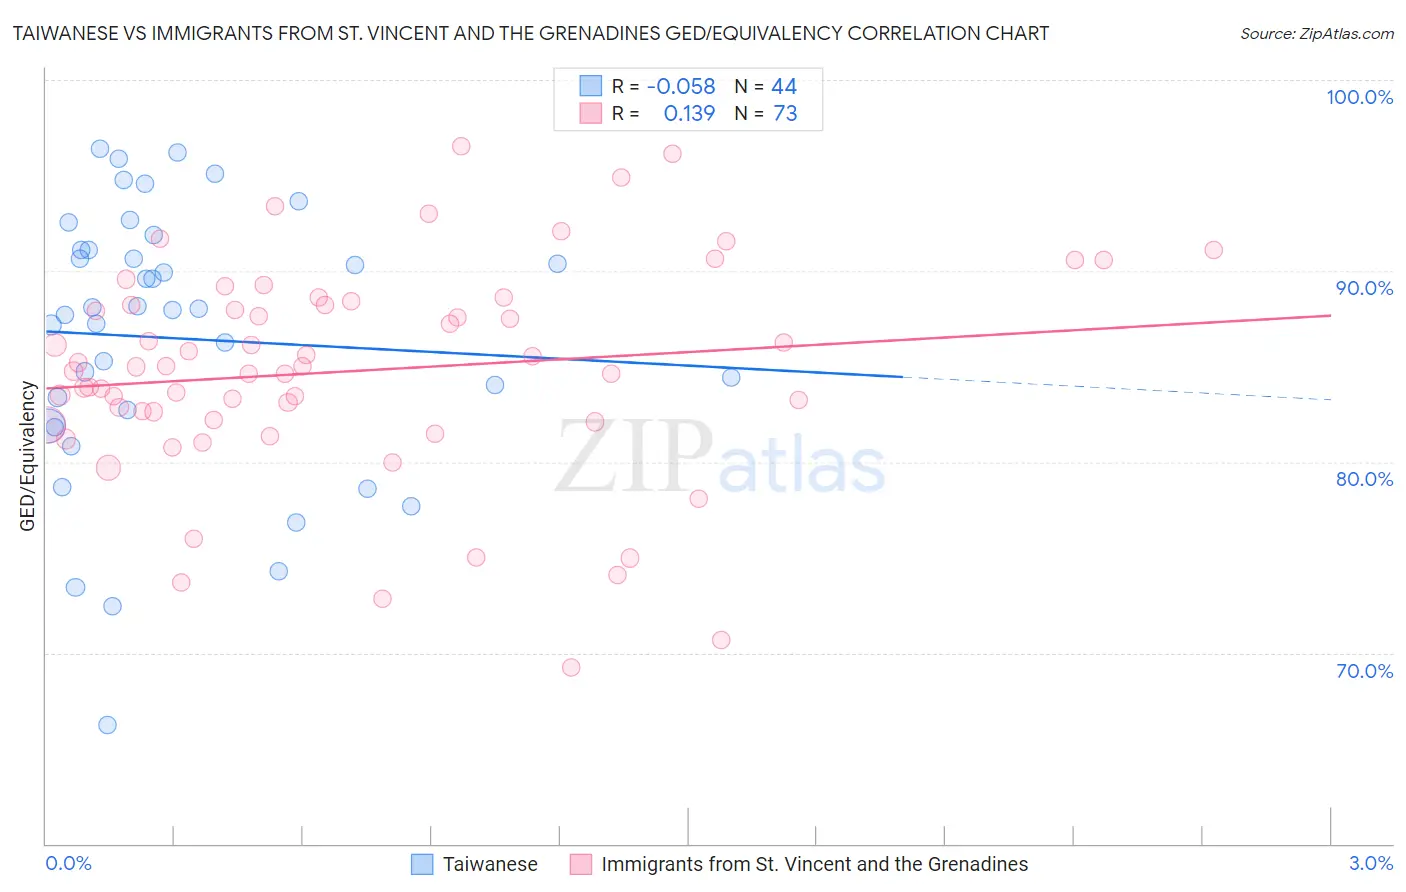
Taiwanese vs Immigrants from St. Vincent and the Grenadines GED/Equivalency Correlation Chart
The statistical analysis conducted on geographies consisting of 31,724,936 people shows a slight negative correlation between the proportion of Taiwanese and percentage of population with at least ged/equivalency education in the United States with a correlation coefficient (R) of -0.058 and weighted average of 84.7%. Similarly, the statistical analysis conducted on geographies consisting of 56,191,418 people shows a poor positive correlation between the proportion of Immigrants from St. Vincent and the Grenadines and percentage of population with at least ged/equivalency education in the United States with a correlation coefficient (R) of 0.139 and weighted average of 82.0%, a difference of 3.3%.
GED/Equivalency Correlation Summary
| Measurement | Taiwanese | Immigrants from St. Vincent and the Grenadines |
| Minimum | 66.2% | 69.2% |
| Maximum | 96.4% | 96.6% |
| Range | 30.1% | 27.3% |
| Mean | 86.5% | 84.8% |
| Median | 88.0% | 85.0% |
| Interquartile 25% (IQ1) | 82.3% | 82.1% |
| Interquartile 75% (IQ3) | 91.1% | 88.3% |
| Interquartile Range (IQR) | 8.8% | 6.2% |
| Standard Deviation (Sample) | 7.0% | 5.6% |
| Standard Deviation (Population) | 7.0% | 5.6% |
Similar Demographics by GED/Equivalency
Demographics Similar to Taiwanese by GED/Equivalency
In terms of ged/equivalency, the demographic groups most similar to Taiwanese are Potawatomi (84.7%, a difference of 0.010%), American (84.7%, a difference of 0.010%), Immigrants from Micronesia (84.7%, a difference of 0.040%), Nigerian (84.7%, a difference of 0.040%), and Alaska Native (84.7%, a difference of 0.040%).
| Demographics | Rating | Rank | GED/Equivalency |
| Osage | 9.5 /100 | #214 | Tragic 84.8% |
| Peruvians | 9.2 /100 | #215 | Tragic 84.7% |
| Immigrants | Micronesia | 8.7 /100 | #216 | Tragic 84.7% |
| Nigerians | 8.6 /100 | #217 | Tragic 84.7% |
| Alaska Natives | 8.6 /100 | #218 | Tragic 84.7% |
| Potawatomi | 8.2 /100 | #219 | Tragic 84.7% |
| Americans | 8.2 /100 | #220 | Tragic 84.7% |
| Taiwanese | 8.1 /100 | #221 | Tragic 84.7% |
| Iroquois | 7.5 /100 | #222 | Tragic 84.6% |
| Immigrants | Uzbekistan | 7.1 /100 | #223 | Tragic 84.6% |
| French American Indians | 6.3 /100 | #224 | Tragic 84.6% |
| Immigrants | Thailand | 5.8 /100 | #225 | Tragic 84.5% |
| Immigrants | Zaire | 5.5 /100 | #226 | Tragic 84.5% |
| Immigrants | Costa Rica | 5.4 /100 | #227 | Tragic 84.5% |
| Immigrants | Liberia | 4.9 /100 | #228 | Tragic 84.4% |
Demographics Similar to Immigrants from St. Vincent and the Grenadines by GED/Equivalency
In terms of ged/equivalency, the demographic groups most similar to Immigrants from St. Vincent and the Grenadines are Paiute (82.0%, a difference of 0.030%), British West Indian (82.0%, a difference of 0.030%), Nepalese (81.9%, a difference of 0.060%), Cuban (82.0%, a difference of 0.070%), and Haitian (82.1%, a difference of 0.090%).
| Demographics | Rating | Rank | GED/Equivalency |
| Japanese | 0.0 /100 | #287 | Tragic 82.4% |
| Pueblo | 0.0 /100 | #288 | Tragic 82.3% |
| Immigrants | Cambodia | 0.0 /100 | #289 | Tragic 82.2% |
| Haitians | 0.0 /100 | #290 | Tragic 82.1% |
| Cubans | 0.0 /100 | #291 | Tragic 82.0% |
| Paiute | 0.0 /100 | #292 | Tragic 82.0% |
| British West Indians | 0.0 /100 | #293 | Tragic 82.0% |
| Immigrants | St. Vincent and the Grenadines | 0.0 /100 | #294 | Tragic 82.0% |
| Nepalese | 0.0 /100 | #295 | Tragic 81.9% |
| Vietnamese | 0.0 /100 | #296 | Tragic 81.9% |
| Immigrants | Bangladesh | 0.0 /100 | #297 | Tragic 81.9% |
| Ute | 0.0 /100 | #298 | Tragic 81.8% |
| Ecuadorians | 0.0 /100 | #299 | Tragic 81.7% |
| Fijians | 0.0 /100 | #300 | Tragic 81.6% |
| Dutch West Indians | 0.0 /100 | #301 | Tragic 81.6% |