Syrian vs Inupiat Professional Degree
COMPARE
Syrian
Inupiat
Professional Degree
Professional Degree Comparison
Syrians
Inupiat
5.2%
PROFESSIONAL DEGREE
99.1/ 100
METRIC RATING
97th/ 347
METRIC RANK
3.2%
PROFESSIONAL DEGREE
0.0/ 100
METRIC RATING
323rd/ 347
METRIC RANK
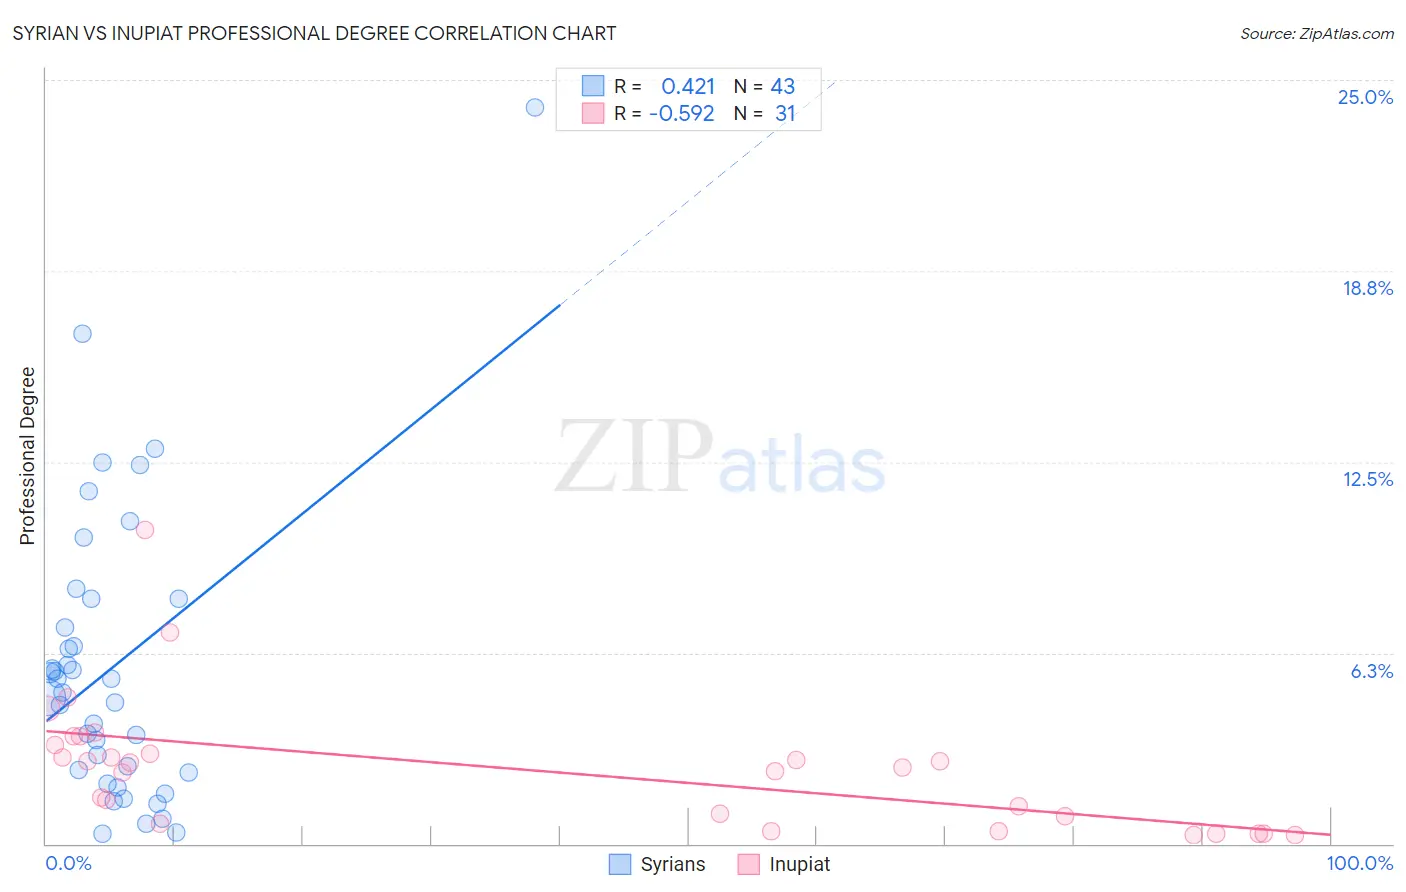
Syrian vs Inupiat Professional Degree Correlation Chart
The statistical analysis conducted on geographies consisting of 266,047,589 people shows a moderate positive correlation between the proportion of Syrians and percentage of population with at least professional degree education in the United States with a correlation coefficient (R) of 0.421 and weighted average of 5.2%. Similarly, the statistical analysis conducted on geographies consisting of 96,206,613 people shows a substantial negative correlation between the proportion of Inupiat and percentage of population with at least professional degree education in the United States with a correlation coefficient (R) of -0.592 and weighted average of 3.2%, a difference of 62.9%.
Professional Degree Correlation Summary
| Measurement | Syrian | Inupiat |
| Minimum | 0.32% | 0.27% |
| Maximum | 24.1% | 10.3% |
| Range | 23.8% | 10.0% |
| Mean | 5.8% | 2.4% |
| Median | 5.0% | 2.5% |
| Interquartile 25% (IQ1) | 2.3% | 0.64% |
| Interquartile 75% (IQ3) | 8.0% | 3.2% |
| Interquartile Range (IQR) | 5.7% | 2.6% |
| Standard Deviation (Sample) | 4.8% | 2.1% |
| Standard Deviation (Population) | 4.7% | 2.1% |
Similar Demographics by Professional Degree
Demographics Similar to Syrians by Professional Degree
In terms of professional degree, the demographic groups most similar to Syrians are Austrian (5.2%, a difference of 0.020%), Immigrants from Italy (5.2%, a difference of 0.080%), Immigrants from Uzbekistan (5.2%, a difference of 0.35%), Zimbabwean (5.2%, a difference of 0.75%), and Ugandan (5.1%, a difference of 0.85%).
| Demographics | Rating | Rank | Professional Degree |
| Immigrants | Scotland | 99.5 /100 | #90 | Exceptional 5.3% |
| Laotians | 99.5 /100 | #91 | Exceptional 5.2% |
| Immigrants | Eastern Europe | 99.5 /100 | #92 | Exceptional 5.2% |
| Northern Europeans | 99.3 /100 | #93 | Exceptional 5.2% |
| Alsatians | 99.3 /100 | #94 | Exceptional 5.2% |
| Zimbabweans | 99.3 /100 | #95 | Exceptional 5.2% |
| Immigrants | Uzbekistan | 99.2 /100 | #96 | Exceptional 5.2% |
| Syrians | 99.1 /100 | #97 | Exceptional 5.2% |
| Austrians | 99.1 /100 | #98 | Exceptional 5.2% |
| Immigrants | Italy | 99.1 /100 | #99 | Exceptional 5.2% |
| Ugandans | 98.8 /100 | #100 | Exceptional 5.1% |
| Immigrants | Egypt | 98.5 /100 | #101 | Exceptional 5.1% |
| Ukrainians | 98.5 /100 | #102 | Exceptional 5.1% |
| Immigrants | Northern Africa | 98.4 /100 | #103 | Exceptional 5.1% |
| Arabs | 98.2 /100 | #104 | Exceptional 5.0% |
Demographics Similar to Inupiat by Professional Degree
In terms of professional degree, the demographic groups most similar to Inupiat are Hispanic or Latino (3.2%, a difference of 0.080%), Crow (3.2%, a difference of 0.27%), Yaqui (3.2%, a difference of 0.34%), Tsimshian (3.2%, a difference of 0.44%), and Seminole (3.2%, a difference of 0.80%).
| Demographics | Rating | Rank | Professional Degree |
| Puerto Ricans | 0.1 /100 | #316 | Tragic 3.2% |
| Nepalese | 0.1 /100 | #317 | Tragic 3.2% |
| Immigrants | Micronesia | 0.1 /100 | #318 | Tragic 3.2% |
| Choctaw | 0.1 /100 | #319 | Tragic 3.2% |
| Seminole | 0.1 /100 | #320 | Tragic 3.2% |
| Tsimshian | 0.0 /100 | #321 | Tragic 3.2% |
| Hispanics or Latinos | 0.0 /100 | #322 | Tragic 3.2% |
| Inupiat | 0.0 /100 | #323 | Tragic 3.2% |
| Crow | 0.0 /100 | #324 | Tragic 3.2% |
| Yaqui | 0.0 /100 | #325 | Tragic 3.2% |
| Menominee | 0.0 /100 | #326 | Tragic 3.1% |
| Dutch West Indians | 0.0 /100 | #327 | Tragic 3.1% |
| Creek | 0.0 /100 | #328 | Tragic 3.1% |
| Bangladeshis | 0.0 /100 | #329 | Tragic 3.1% |
| Immigrants | Cabo Verde | 0.0 /100 | #330 | Tragic 3.1% |