Syrian vs Immigrants from Haiti Professional Degree
COMPARE
Syrian
Immigrants from Haiti
Professional Degree
Professional Degree Comparison
Syrians
Immigrants from Haiti
5.2%
PROFESSIONAL DEGREE
99.1/ 100
METRIC RATING
97th/ 347
METRIC RANK
3.4%
PROFESSIONAL DEGREE
0.2/ 100
METRIC RATING
303rd/ 347
METRIC RANK
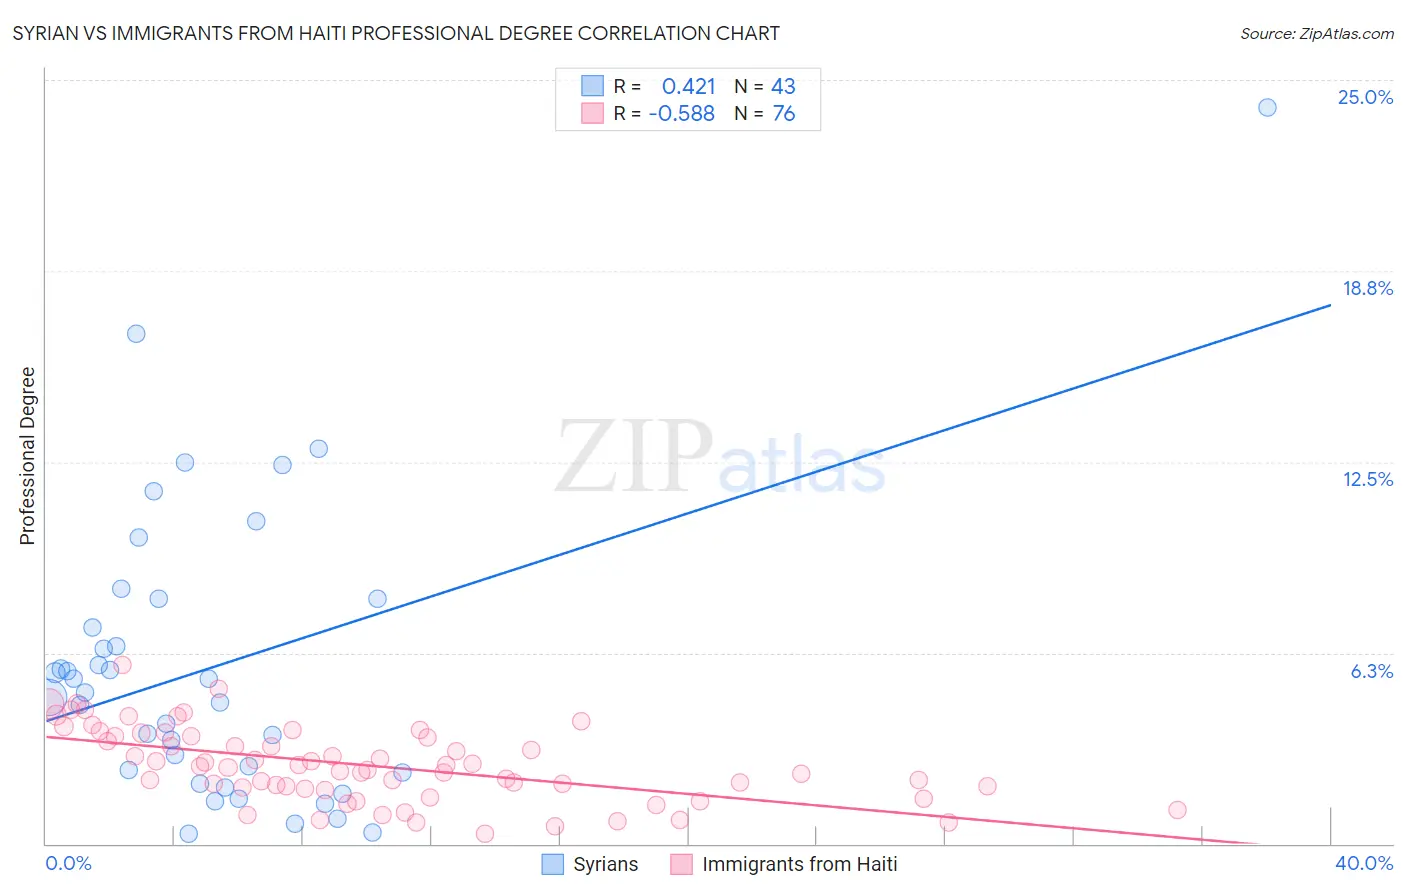
Syrian vs Immigrants from Haiti Professional Degree Correlation Chart
The statistical analysis conducted on geographies consisting of 266,047,589 people shows a moderate positive correlation between the proportion of Syrians and percentage of population with at least professional degree education in the United States with a correlation coefficient (R) of 0.421 and weighted average of 5.2%. Similarly, the statistical analysis conducted on geographies consisting of 224,987,454 people shows a substantial negative correlation between the proportion of Immigrants from Haiti and percentage of population with at least professional degree education in the United States with a correlation coefficient (R) of -0.588 and weighted average of 3.4%, a difference of 53.0%.
Professional Degree Correlation Summary
| Measurement | Syrian | Immigrants from Haiti |
| Minimum | 0.32% | 0.34% |
| Maximum | 24.1% | 5.9% |
| Range | 23.8% | 5.5% |
| Mean | 5.8% | 2.6% |
| Median | 5.0% | 2.5% |
| Interquartile 25% (IQ1) | 2.3% | 1.8% |
| Interquartile 75% (IQ3) | 8.0% | 3.5% |
| Interquartile Range (IQR) | 5.7% | 1.7% |
| Standard Deviation (Sample) | 4.8% | 1.2% |
| Standard Deviation (Population) | 4.7% | 1.2% |
Similar Demographics by Professional Degree
Demographics Similar to Syrians by Professional Degree
In terms of professional degree, the demographic groups most similar to Syrians are Austrian (5.2%, a difference of 0.020%), Immigrants from Italy (5.2%, a difference of 0.080%), Immigrants from Uzbekistan (5.2%, a difference of 0.35%), Zimbabwean (5.2%, a difference of 0.75%), and Ugandan (5.1%, a difference of 0.85%).
| Demographics | Rating | Rank | Professional Degree |
| Immigrants | Scotland | 99.5 /100 | #90 | Exceptional 5.3% |
| Laotians | 99.5 /100 | #91 | Exceptional 5.2% |
| Immigrants | Eastern Europe | 99.5 /100 | #92 | Exceptional 5.2% |
| Northern Europeans | 99.3 /100 | #93 | Exceptional 5.2% |
| Alsatians | 99.3 /100 | #94 | Exceptional 5.2% |
| Zimbabweans | 99.3 /100 | #95 | Exceptional 5.2% |
| Immigrants | Uzbekistan | 99.2 /100 | #96 | Exceptional 5.2% |
| Syrians | 99.1 /100 | #97 | Exceptional 5.2% |
| Austrians | 99.1 /100 | #98 | Exceptional 5.2% |
| Immigrants | Italy | 99.1 /100 | #99 | Exceptional 5.2% |
| Ugandans | 98.8 /100 | #100 | Exceptional 5.1% |
| Immigrants | Egypt | 98.5 /100 | #101 | Exceptional 5.1% |
| Ukrainians | 98.5 /100 | #102 | Exceptional 5.1% |
| Immigrants | Northern Africa | 98.4 /100 | #103 | Exceptional 5.1% |
| Arabs | 98.2 /100 | #104 | Exceptional 5.0% |
Demographics Similar to Immigrants from Haiti by Professional Degree
In terms of professional degree, the demographic groups most similar to Immigrants from Haiti are Cajun (3.4%, a difference of 0.010%), Chickasaw (3.4%, a difference of 0.31%), Cape Verdean (3.4%, a difference of 0.32%), Malaysian (3.4%, a difference of 0.66%), and Immigrants from Dominican Republic (3.4%, a difference of 0.76%).
| Demographics | Rating | Rank | Professional Degree |
| Hawaiians | 0.2 /100 | #296 | Tragic 3.4% |
| Immigrants | Liberia | 0.2 /100 | #297 | Tragic 3.4% |
| Ottawa | 0.2 /100 | #298 | Tragic 3.4% |
| Immigrants | Yemen | 0.2 /100 | #299 | Tragic 3.4% |
| Blacks/African Americans | 0.2 /100 | #300 | Tragic 3.4% |
| Immigrants | Dominican Republic | 0.2 /100 | #301 | Tragic 3.4% |
| Malaysians | 0.2 /100 | #302 | Tragic 3.4% |
| Immigrants | Haiti | 0.2 /100 | #303 | Tragic 3.4% |
| Cajuns | 0.2 /100 | #304 | Tragic 3.4% |
| Chickasaw | 0.1 /100 | #305 | Tragic 3.4% |
| Cape Verdeans | 0.1 /100 | #306 | Tragic 3.4% |
| Samoans | 0.1 /100 | #307 | Tragic 3.3% |
| Shoshone | 0.1 /100 | #308 | Tragic 3.3% |
| Pima | 0.1 /100 | #309 | Tragic 3.3% |
| Immigrants | Latin America | 0.1 /100 | #310 | Tragic 3.3% |