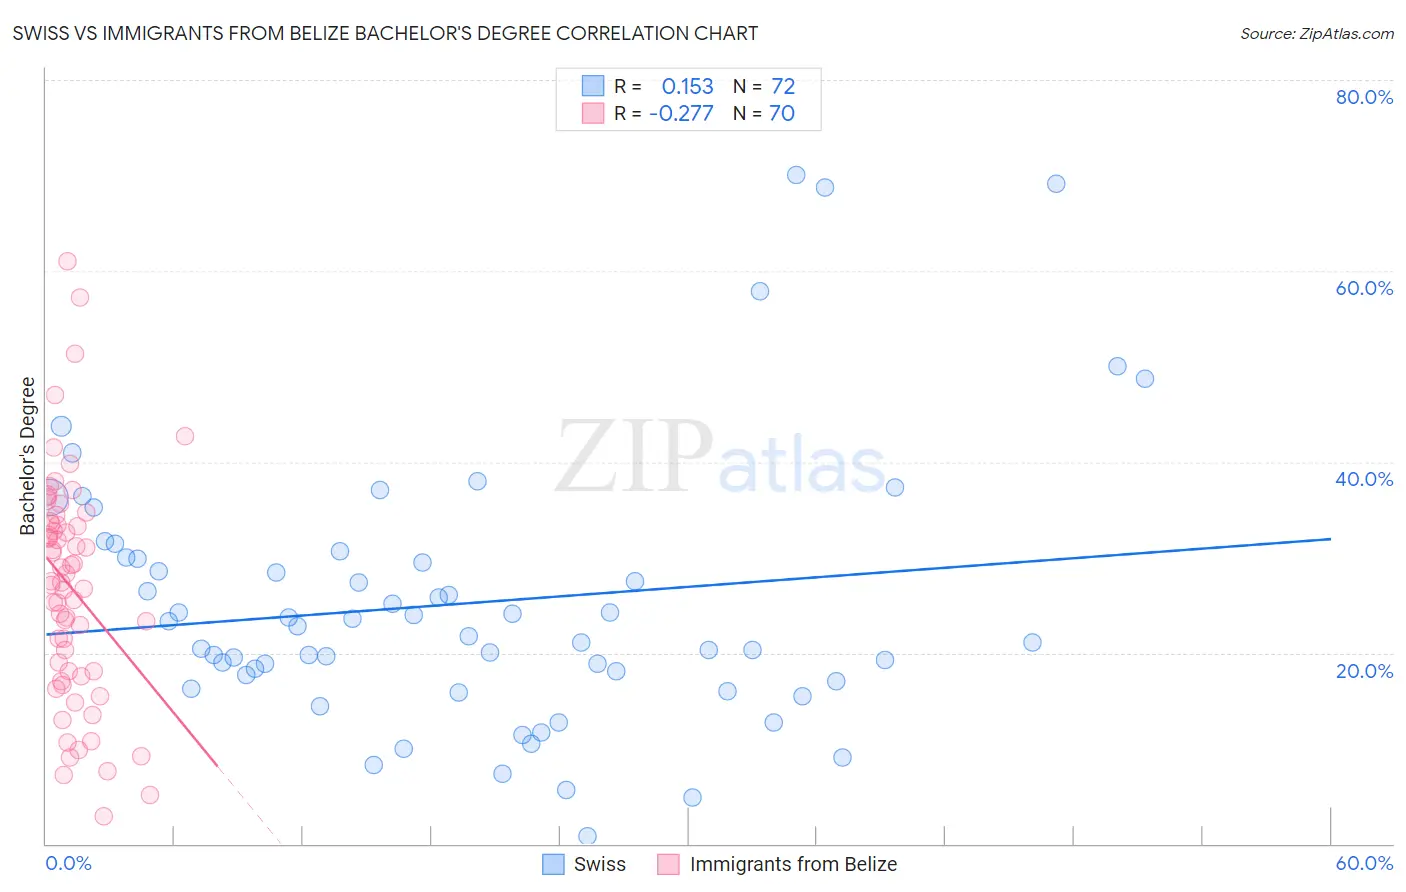
Swiss vs Immigrants from Belize Bachelor's Degree
COMPARE
Swiss
Immigrants from Belize
Bachelor's Degree
Bachelor's Degree Comparison
Swiss
Immigrants from Belize
37.2%
BACHELOR'S DEGREE
34.1/ 100
METRIC RATING
190th/ 347
METRIC RANK
32.1%
BACHELOR'S DEGREE
0.2/ 100
METRIC RATING
269th/ 347
METRIC RANK
Swiss vs Immigrants from Belize Bachelor's Degree Correlation Chart
The statistical analysis conducted on geographies consisting of 464,980,651 people shows a poor positive correlation between the proportion of Swiss and percentage of population with at least bachelor's degree education in the United States with a correlation coefficient (R) of 0.153 and weighted average of 37.2%. Similarly, the statistical analysis conducted on geographies consisting of 130,322,630 people shows a weak negative correlation between the proportion of Immigrants from Belize and percentage of population with at least bachelor's degree education in the United States with a correlation coefficient (R) of -0.277 and weighted average of 32.1%, a difference of 15.9%.
Bachelor's Degree Correlation Summary
| Measurement | Swiss | Immigrants from Belize |
| Minimum | 0.82% | 2.9% |
| Maximum | 70.0% | 61.0% |
| Range | 69.2% | 58.1% |
| Mean | 25.2% | 26.8% |
| Median | 22.2% | 27.4% |
| Interquartile 25% (IQ1) | 17.3% | 18.1% |
| Interquartile 75% (IQ3) | 29.9% | 33.5% |
| Interquartile Range (IQR) | 12.6% | 15.4% |
| Standard Deviation (Sample) | 14.1% | 11.8% |
| Standard Deviation (Population) | 14.0% | 11.7% |
Similar Demographics by Bachelor's Degree
Demographics Similar to Swiss by Bachelor's Degree
In terms of bachelor's degree, the demographic groups most similar to Swiss are Nigerian (37.2%, a difference of 0.020%), Immigrants from Vietnam (37.1%, a difference of 0.22%), Yugoslavian (37.1%, a difference of 0.29%), Slovak (37.3%, a difference of 0.30%), and Immigrants from Oceania (37.3%, a difference of 0.35%).
| Demographics | Rating | Rank | Bachelor's Degree |
| Senegalese | 42.2 /100 | #183 | Average 37.5% |
| Scandinavians | 41.7 /100 | #184 | Average 37.5% |
| Immigrants | Peru | 41.3 /100 | #185 | Average 37.5% |
| Norwegians | 40.4 /100 | #186 | Average 37.5% |
| English | 39.7 /100 | #187 | Fair 37.4% |
| Immigrants | Oceania | 37.3 /100 | #188 | Fair 37.3% |
| Slovaks | 36.9 /100 | #189 | Fair 37.3% |
| Swiss | 34.1 /100 | #190 | Fair 37.2% |
| Nigerians | 33.9 /100 | #191 | Fair 37.2% |
| Immigrants | Vietnam | 32.1 /100 | #192 | Fair 37.1% |
| Yugoslavians | 31.5 /100 | #193 | Fair 37.1% |
| Belgians | 29.9 /100 | #194 | Fair 37.0% |
| Koreans | 29.8 /100 | #195 | Fair 37.0% |
| Celtics | 29.5 /100 | #196 | Fair 37.0% |
| Czechoslovakians | 29.2 /100 | #197 | Fair 37.0% |
Demographics Similar to Immigrants from Belize by Bachelor's Degree
In terms of bachelor's degree, the demographic groups most similar to Immigrants from Belize are Immigrants from Portugal (32.2%, a difference of 0.41%), Immigrants from Nicaragua (31.9%, a difference of 0.54%), Central American (31.9%, a difference of 0.63%), Comanche (31.9%, a difference of 0.66%), and American (31.9%, a difference of 0.78%).
| Demographics | Rating | Rank | Bachelor's Degree |
| Immigrants | Jamaica | 0.5 /100 | #262 | Tragic 32.9% |
| Belizeans | 0.4 /100 | #263 | Tragic 32.8% |
| Central American Indians | 0.3 /100 | #264 | Tragic 32.5% |
| Bahamians | 0.3 /100 | #265 | Tragic 32.5% |
| Immigrants | Dominica | 0.3 /100 | #266 | Tragic 32.5% |
| Cubans | 0.3 /100 | #267 | Tragic 32.5% |
| Immigrants | Portugal | 0.2 /100 | #268 | Tragic 32.2% |
| Immigrants | Belize | 0.2 /100 | #269 | Tragic 32.1% |
| Immigrants | Nicaragua | 0.2 /100 | #270 | Tragic 31.9% |
| Central Americans | 0.2 /100 | #271 | Tragic 31.9% |
| Comanche | 0.2 /100 | #272 | Tragic 31.9% |
| Americans | 0.2 /100 | #273 | Tragic 31.9% |
| Potawatomi | 0.2 /100 | #274 | Tragic 31.9% |
| Samoans | 0.1 /100 | #275 | Tragic 31.8% |
| Salvadorans | 0.1 /100 | #276 | Tragic 31.8% |