British vs Immigrants from Belize Bachelor's Degree
COMPARE
British
Immigrants from Belize
Bachelor's Degree
Bachelor's Degree Comparison
British
Immigrants from Belize
40.4%
BACHELOR'S DEGREE
94.2/ 100
METRIC RATING
125th/ 347
METRIC RANK
32.1%
BACHELOR'S DEGREE
0.2/ 100
METRIC RATING
269th/ 347
METRIC RANK
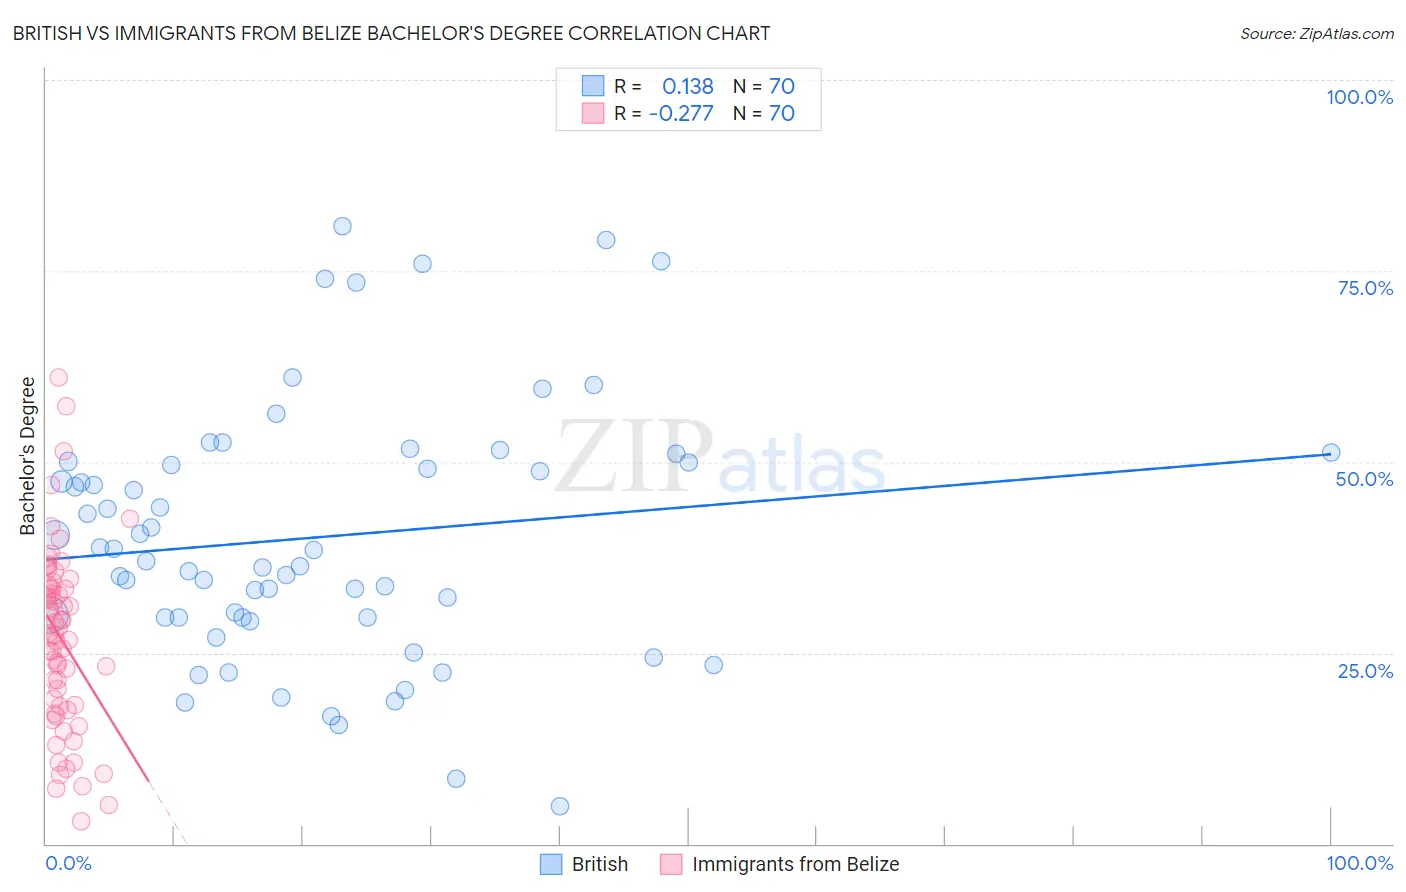
British vs Immigrants from Belize Bachelor's Degree Correlation Chart
The statistical analysis conducted on geographies consisting of 531,374,091 people shows a poor positive correlation between the proportion of British and percentage of population with at least bachelor's degree education in the United States with a correlation coefficient (R) of 0.138 and weighted average of 40.4%. Similarly, the statistical analysis conducted on geographies consisting of 130,322,630 people shows a weak negative correlation between the proportion of Immigrants from Belize and percentage of population with at least bachelor's degree education in the United States with a correlation coefficient (R) of -0.277 and weighted average of 32.1%, a difference of 25.8%.
Bachelor's Degree Correlation Summary
| Measurement | British | Immigrants from Belize |
| Minimum | 5.0% | 2.9% |
| Maximum | 80.9% | 61.0% |
| Range | 76.0% | 58.1% |
| Mean | 40.1% | 26.8% |
| Median | 37.7% | 27.4% |
| Interquartile 25% (IQ1) | 29.6% | 18.1% |
| Interquartile 75% (IQ3) | 50.0% | 33.5% |
| Interquartile Range (IQR) | 20.4% | 15.4% |
| Standard Deviation (Sample) | 16.7% | 11.8% |
| Standard Deviation (Population) | 16.6% | 11.7% |
Similar Demographics by Bachelor's Degree
Demographics Similar to British by Bachelor's Degree
In terms of bachelor's degree, the demographic groups most similar to British are Immigrants from Eritrea (40.4%, a difference of 0.030%), Lebanese (40.4%, a difference of 0.040%), Immigrants from Eastern Africa (40.4%, a difference of 0.050%), Immigrants from Albania (40.4%, a difference of 0.060%), and Moroccan (40.5%, a difference of 0.16%).
| Demographics | Rating | Rank | Bachelor's Degree |
| Croatians | 95.5 /100 | #118 | Exceptional 40.6% |
| Immigrants | Syria | 94.9 /100 | #119 | Exceptional 40.5% |
| Venezuelans | 94.7 /100 | #120 | Exceptional 40.5% |
| Moroccans | 94.6 /100 | #121 | Exceptional 40.5% |
| Immigrants | Albania | 94.4 /100 | #122 | Exceptional 40.4% |
| Lebanese | 94.3 /100 | #123 | Exceptional 40.4% |
| Immigrants | Eritrea | 94.3 /100 | #124 | Exceptional 40.4% |
| British | 94.2 /100 | #125 | Exceptional 40.4% |
| Immigrants | Eastern Africa | 94.1 /100 | #126 | Exceptional 40.4% |
| Immigrants | Jordan | 93.4 /100 | #127 | Exceptional 40.3% |
| Immigrants | Venezuela | 92.9 /100 | #128 | Exceptional 40.2% |
| Serbians | 92.4 /100 | #129 | Exceptional 40.1% |
| Sierra Leoneans | 92.2 /100 | #130 | Exceptional 40.1% |
| Italians | 91.9 /100 | #131 | Exceptional 40.1% |
| Taiwanese | 91.1 /100 | #132 | Exceptional 40.0% |
Demographics Similar to Immigrants from Belize by Bachelor's Degree
In terms of bachelor's degree, the demographic groups most similar to Immigrants from Belize are Immigrants from Portugal (32.2%, a difference of 0.41%), Immigrants from Nicaragua (31.9%, a difference of 0.54%), Central American (31.9%, a difference of 0.63%), Comanche (31.9%, a difference of 0.66%), and American (31.9%, a difference of 0.78%).
| Demographics | Rating | Rank | Bachelor's Degree |
| Immigrants | Jamaica | 0.5 /100 | #262 | Tragic 32.9% |
| Belizeans | 0.4 /100 | #263 | Tragic 32.8% |
| Central American Indians | 0.3 /100 | #264 | Tragic 32.5% |
| Bahamians | 0.3 /100 | #265 | Tragic 32.5% |
| Immigrants | Dominica | 0.3 /100 | #266 | Tragic 32.5% |
| Cubans | 0.3 /100 | #267 | Tragic 32.5% |
| Immigrants | Portugal | 0.2 /100 | #268 | Tragic 32.2% |
| Immigrants | Belize | 0.2 /100 | #269 | Tragic 32.1% |
| Immigrants | Nicaragua | 0.2 /100 | #270 | Tragic 31.9% |
| Central Americans | 0.2 /100 | #271 | Tragic 31.9% |
| Comanche | 0.2 /100 | #272 | Tragic 31.9% |
| Americans | 0.2 /100 | #273 | Tragic 31.9% |
| Potawatomi | 0.2 /100 | #274 | Tragic 31.9% |
| Samoans | 0.1 /100 | #275 | Tragic 31.8% |
| Salvadorans | 0.1 /100 | #276 | Tragic 31.8% |