Sudanese vs Immigrants from El Salvador 10th Grade
COMPARE
Sudanese
Immigrants from El Salvador
10th Grade
10th Grade Comparison
Sudanese
Immigrants from El Salvador
93.6%
10TH GRADE
36.6/ 100
METRIC RATING
185th/ 347
METRIC RANK
86.8%
10TH GRADE
0.0/ 100
METRIC RATING
344th/ 347
METRIC RANK
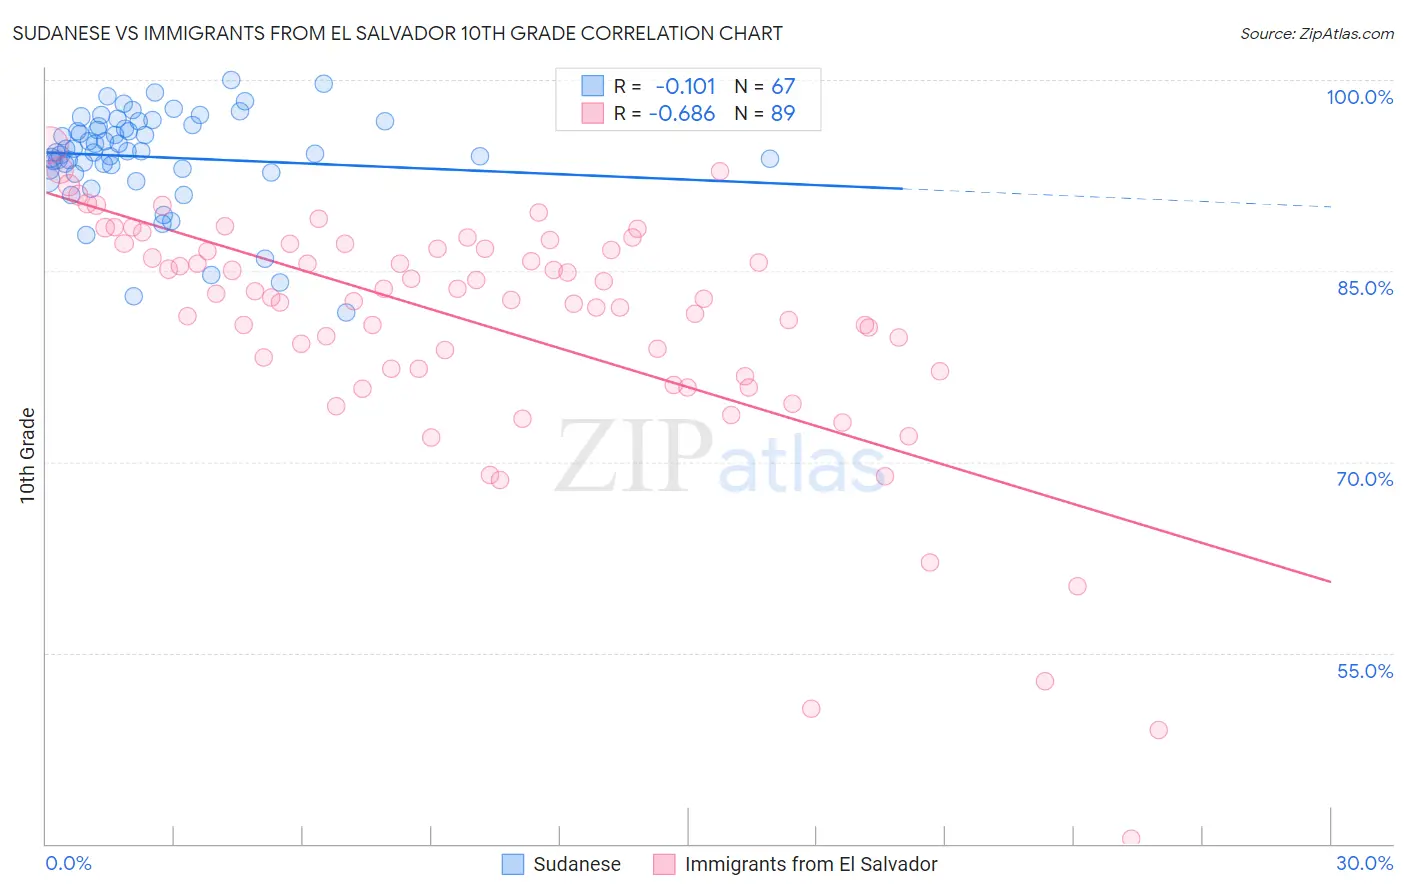
Sudanese vs Immigrants from El Salvador 10th Grade Correlation Chart
The statistical analysis conducted on geographies consisting of 110,134,719 people shows a poor negative correlation between the proportion of Sudanese and percentage of population with at least 10th grade education in the United States with a correlation coefficient (R) of -0.101 and weighted average of 93.6%. Similarly, the statistical analysis conducted on geographies consisting of 357,852,518 people shows a significant negative correlation between the proportion of Immigrants from El Salvador and percentage of population with at least 10th grade education in the United States with a correlation coefficient (R) of -0.686 and weighted average of 86.8%, a difference of 7.9%.
10th Grade Correlation Summary
| Measurement | Sudanese | Immigrants from El Salvador |
| Minimum | 81.8% | 40.3% |
| Maximum | 100.0% | 94.9% |
| Range | 18.2% | 54.6% |
| Mean | 93.9% | 80.8% |
| Median | 94.4% | 82.9% |
| Interquartile 25% (IQ1) | 93.0% | 77.2% |
| Interquartile 75% (IQ3) | 96.5% | 87.0% |
| Interquartile Range (IQR) | 3.5% | 9.8% |
| Standard Deviation (Sample) | 3.8% | 9.7% |
| Standard Deviation (Population) | 3.8% | 9.7% |
Similar Demographics by 10th Grade
Demographics Similar to Sudanese by 10th Grade
In terms of 10th grade, the demographic groups most similar to Sudanese are Guamanian/Chamorro (93.6%, a difference of 0.0%), Choctaw (93.6%, a difference of 0.0%), Immigrants from Eastern Asia (93.6%, a difference of 0.010%), Colville (93.6%, a difference of 0.020%), and Liberian (93.6%, a difference of 0.020%).
| Demographics | Rating | Rank | 10th Grade |
| Sierra Leoneans | 46.1 /100 | #178 | Average 93.7% |
| Paraguayans | 45.3 /100 | #179 | Average 93.7% |
| Blackfeet | 42.8 /100 | #180 | Average 93.7% |
| Immigrants | Northern Africa | 41.6 /100 | #181 | Average 93.7% |
| Colville | 38.8 /100 | #182 | Fair 93.6% |
| Guamanians/Chamorros | 37.1 /100 | #183 | Fair 93.6% |
| Choctaw | 36.6 /100 | #184 | Fair 93.6% |
| Sudanese | 36.6 /100 | #185 | Fair 93.6% |
| Immigrants | Eastern Asia | 35.1 /100 | #186 | Fair 93.6% |
| Liberians | 34.7 /100 | #187 | Fair 93.6% |
| Marshallese | 33.2 /100 | #188 | Fair 93.6% |
| Immigrants | Pakistan | 32.5 /100 | #189 | Fair 93.6% |
| Laotians | 32.1 /100 | #190 | Fair 93.6% |
| Yup'ik | 31.1 /100 | #191 | Fair 93.6% |
| Immigrants | Malaysia | 28.0 /100 | #192 | Fair 93.5% |
Demographics Similar to Immigrants from El Salvador by 10th Grade
In terms of 10th grade, the demographic groups most similar to Immigrants from El Salvador are Yakama (86.9%, a difference of 0.14%), Immigrants from Central America (86.6%, a difference of 0.18%), Spanish American Indian (86.2%, a difference of 0.63%), Immigrants from Mexico (86.2%, a difference of 0.65%), and Immigrants from Guatemala (87.4%, a difference of 0.72%).
| Demographics | Rating | Rank | 10th Grade |
| Hondurans | 0.0 /100 | #333 | Tragic 89.0% |
| Hispanics or Latinos | 0.0 /100 | #334 | Tragic 88.9% |
| Immigrants | Dominican Republic | 0.0 /100 | #335 | Tragic 88.7% |
| Immigrants | Honduras | 0.0 /100 | #336 | Tragic 88.5% |
| Central Americans | 0.0 /100 | #337 | Tragic 88.4% |
| Immigrants | Latin America | 0.0 /100 | #338 | Tragic 88.3% |
| Guatemalans | 0.0 /100 | #339 | Tragic 87.9% |
| Mexicans | 0.0 /100 | #340 | Tragic 87.8% |
| Salvadorans | 0.0 /100 | #341 | Tragic 87.5% |
| Immigrants | Guatemala | 0.0 /100 | #342 | Tragic 87.4% |
| Yakama | 0.0 /100 | #343 | Tragic 86.9% |
| Immigrants | El Salvador | 0.0 /100 | #344 | Tragic 86.8% |
| Immigrants | Central America | 0.0 /100 | #345 | Tragic 86.6% |
| Spanish American Indians | 0.0 /100 | #346 | Tragic 86.2% |
| Immigrants | Mexico | 0.0 /100 | #347 | Tragic 86.2% |