Shoshone vs Immigrants from El Salvador 10th Grade
COMPARE
Shoshone
Immigrants from El Salvador
10th Grade
10th Grade Comparison
Shoshone
Immigrants from El Salvador
94.2%
10TH GRADE
90.8/ 100
METRIC RATING
136th/ 347
METRIC RANK
86.8%
10TH GRADE
0.0/ 100
METRIC RATING
344th/ 347
METRIC RANK
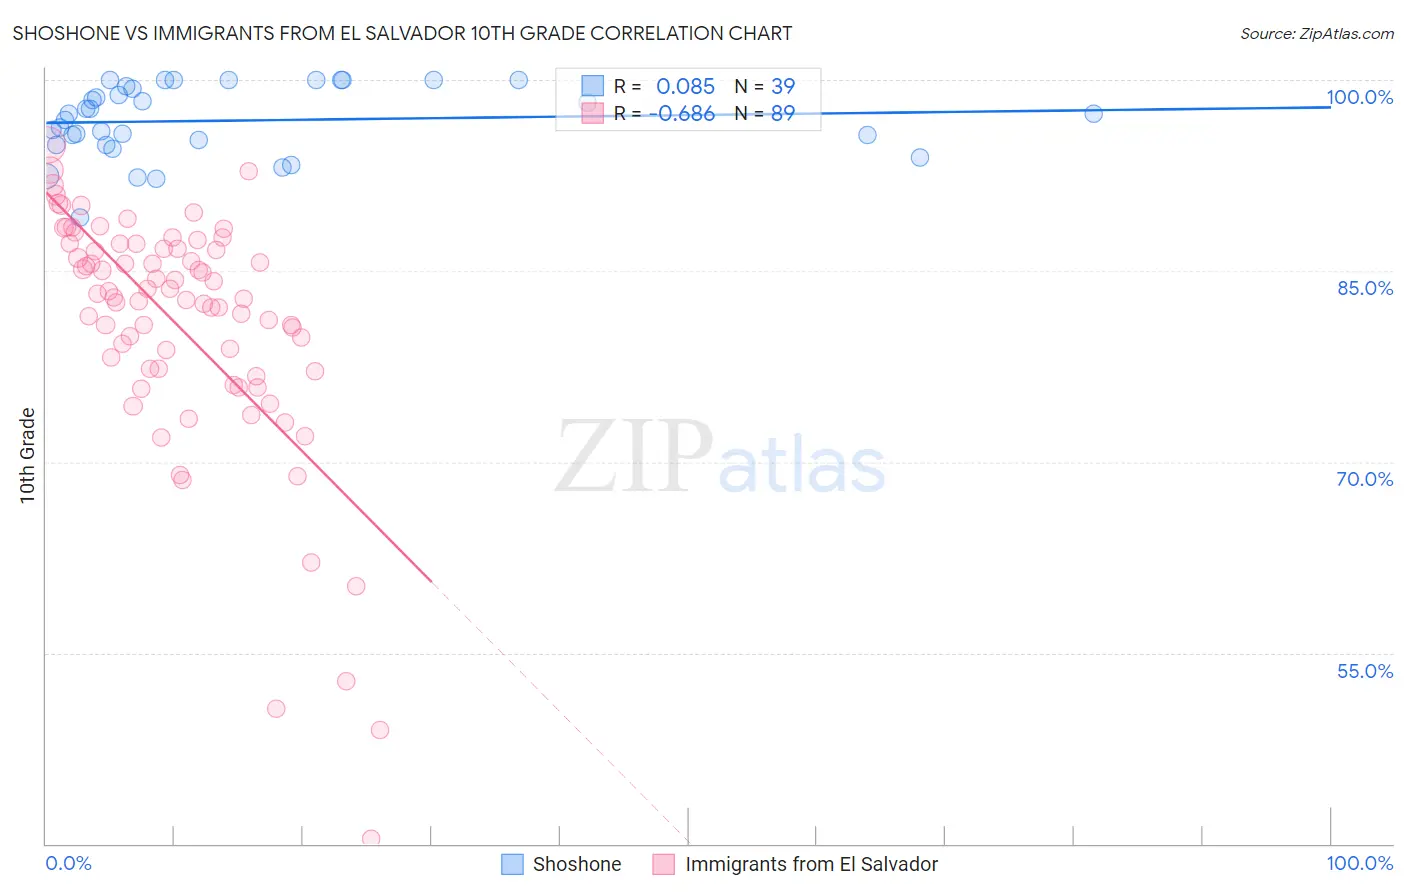
Shoshone vs Immigrants from El Salvador 10th Grade Correlation Chart
The statistical analysis conducted on geographies consisting of 66,625,086 people shows a slight positive correlation between the proportion of Shoshone and percentage of population with at least 10th grade education in the United States with a correlation coefficient (R) of 0.085 and weighted average of 94.2%. Similarly, the statistical analysis conducted on geographies consisting of 357,852,518 people shows a significant negative correlation between the proportion of Immigrants from El Salvador and percentage of population with at least 10th grade education in the United States with a correlation coefficient (R) of -0.686 and weighted average of 86.8%, a difference of 8.6%.
10th Grade Correlation Summary
| Measurement | Shoshone | Immigrants from El Salvador |
| Minimum | 89.2% | 40.3% |
| Maximum | 100.0% | 94.9% |
| Range | 10.8% | 54.6% |
| Mean | 96.8% | 80.8% |
| Median | 97.3% | 82.9% |
| Interquartile 25% (IQ1) | 94.9% | 77.2% |
| Interquartile 75% (IQ3) | 99.5% | 87.0% |
| Interquartile Range (IQR) | 4.6% | 9.8% |
| Standard Deviation (Sample) | 2.8% | 9.7% |
| Standard Deviation (Population) | 2.7% | 9.7% |
Similar Demographics by 10th Grade
Demographics Similar to Shoshone by 10th Grade
In terms of 10th grade, the demographic groups most similar to Shoshone are Immigrants from Korea (94.2%, a difference of 0.010%), Arapaho (94.2%, a difference of 0.010%), Immigrants from Sri Lanka (94.2%, a difference of 0.020%), Creek (94.2%, a difference of 0.030%), and Osage (94.2%, a difference of 0.030%).
| Demographics | Rating | Rank | 10th Grade |
| Iroquois | 92.8 /100 | #129 | Exceptional 94.3% |
| Immigrants | Greece | 92.7 /100 | #130 | Exceptional 94.3% |
| Immigrants | Eastern Europe | 92.5 /100 | #131 | Exceptional 94.3% |
| Immigrants | Russia | 92.4 /100 | #132 | Exceptional 94.3% |
| Creek | 91.9 /100 | #133 | Exceptional 94.2% |
| Osage | 91.7 /100 | #134 | Exceptional 94.2% |
| Immigrants | Korea | 91.3 /100 | #135 | Exceptional 94.2% |
| Shoshone | 90.8 /100 | #136 | Exceptional 94.2% |
| Arapaho | 90.5 /100 | #137 | Exceptional 94.2% |
| Immigrants | Sri Lanka | 89.9 /100 | #138 | Excellent 94.2% |
| Immigrants | Bosnia and Herzegovina | 89.4 /100 | #139 | Excellent 94.2% |
| Immigrants | Jordan | 87.6 /100 | #140 | Excellent 94.1% |
| Hmong | 86.6 /100 | #141 | Excellent 94.1% |
| Albanians | 86.5 /100 | #142 | Excellent 94.1% |
| Cherokee | 84.9 /100 | #143 | Excellent 94.1% |
Demographics Similar to Immigrants from El Salvador by 10th Grade
In terms of 10th grade, the demographic groups most similar to Immigrants from El Salvador are Yakama (86.9%, a difference of 0.14%), Immigrants from Central America (86.6%, a difference of 0.18%), Spanish American Indian (86.2%, a difference of 0.63%), Immigrants from Mexico (86.2%, a difference of 0.65%), and Immigrants from Guatemala (87.4%, a difference of 0.72%).
| Demographics | Rating | Rank | 10th Grade |
| Hondurans | 0.0 /100 | #333 | Tragic 89.0% |
| Hispanics or Latinos | 0.0 /100 | #334 | Tragic 88.9% |
| Immigrants | Dominican Republic | 0.0 /100 | #335 | Tragic 88.7% |
| Immigrants | Honduras | 0.0 /100 | #336 | Tragic 88.5% |
| Central Americans | 0.0 /100 | #337 | Tragic 88.4% |
| Immigrants | Latin America | 0.0 /100 | #338 | Tragic 88.3% |
| Guatemalans | 0.0 /100 | #339 | Tragic 87.9% |
| Mexicans | 0.0 /100 | #340 | Tragic 87.8% |
| Salvadorans | 0.0 /100 | #341 | Tragic 87.5% |
| Immigrants | Guatemala | 0.0 /100 | #342 | Tragic 87.4% |
| Yakama | 0.0 /100 | #343 | Tragic 86.9% |
| Immigrants | El Salvador | 0.0 /100 | #344 | Tragic 86.8% |
| Immigrants | Central America | 0.0 /100 | #345 | Tragic 86.6% |
| Spanish American Indians | 0.0 /100 | #346 | Tragic 86.2% |
| Immigrants | Mexico | 0.0 /100 | #347 | Tragic 86.2% |