Spanish American vs Immigrants from South Africa 11th Grade
COMPARE
Spanish American
Immigrants from South Africa
11th Grade
11th Grade Comparison
Spanish Americans
Immigrants from South Africa
91.4%
11TH GRADE
0.6/ 100
METRIC RATING
260th/ 347
METRIC RANK
93.8%
11TH GRADE
99.7/ 100
METRIC RATING
71st/ 347
METRIC RANK
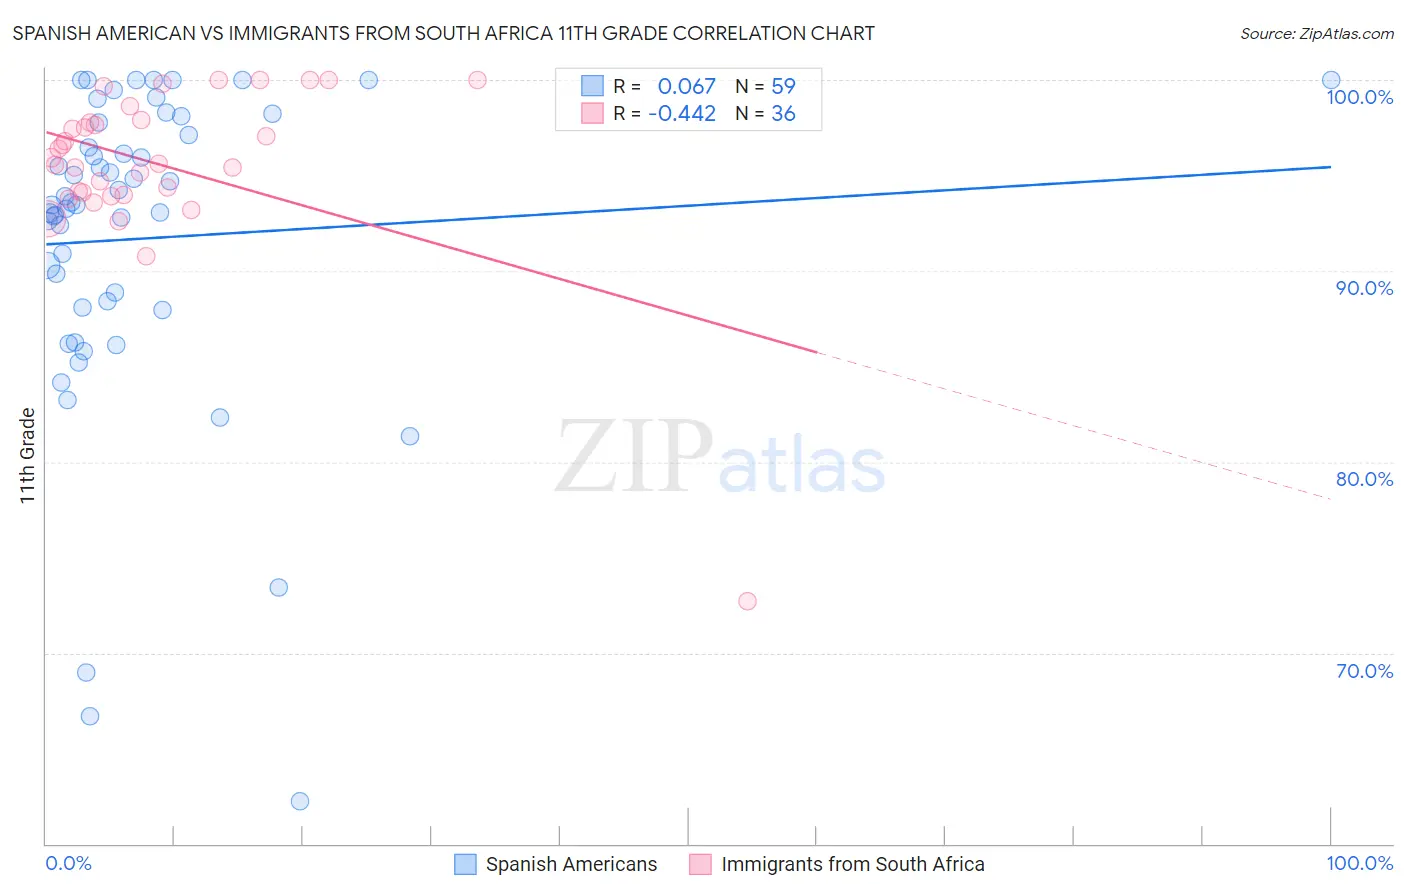
Spanish American vs Immigrants from South Africa 11th Grade Correlation Chart
The statistical analysis conducted on geographies consisting of 103,168,542 people shows a slight positive correlation between the proportion of Spanish Americans and percentage of population with at least 11th grade education in the United States with a correlation coefficient (R) of 0.067 and weighted average of 91.4%. Similarly, the statistical analysis conducted on geographies consisting of 233,321,693 people shows a moderate negative correlation between the proportion of Immigrants from South Africa and percentage of population with at least 11th grade education in the United States with a correlation coefficient (R) of -0.442 and weighted average of 93.8%, a difference of 2.7%.
11th Grade Correlation Summary
| Measurement | Spanish American | Immigrants from South Africa |
| Minimum | 62.3% | 72.7% |
| Maximum | 100.0% | 100.0% |
| Range | 37.7% | 27.3% |
| Mean | 91.7% | 95.6% |
| Median | 93.5% | 95.8% |
| Interquartile 25% (IQ1) | 88.1% | 94.1% |
| Interquartile 75% (IQ3) | 97.8% | 97.8% |
| Interquartile Range (IQR) | 9.7% | 3.8% |
| Standard Deviation (Sample) | 8.3% | 4.6% |
| Standard Deviation (Population) | 8.2% | 4.6% |
Similar Demographics by 11th Grade
Demographics Similar to Spanish Americans by 11th Grade
In terms of 11th grade, the demographic groups most similar to Spanish Americans are Jamaican (91.4%, a difference of 0.010%), Taiwanese (91.3%, a difference of 0.010%), Immigrants from Colombia (91.4%, a difference of 0.020%), Immigrants from Uruguay (91.3%, a difference of 0.020%), and Cajun (91.4%, a difference of 0.040%).
| Demographics | Rating | Rank | 11th Grade |
| Immigrants | South America | 0.8 /100 | #253 | Tragic 91.4% |
| Immigrants | Eritrea | 0.7 /100 | #254 | Tragic 91.4% |
| Blacks/African Americans | 0.7 /100 | #255 | Tragic 91.4% |
| Immigrants | Senegal | 0.7 /100 | #256 | Tragic 91.4% |
| Cajuns | 0.7 /100 | #257 | Tragic 91.4% |
| Immigrants | Colombia | 0.6 /100 | #258 | Tragic 91.4% |
| Jamaicans | 0.6 /100 | #259 | Tragic 91.4% |
| Spanish Americans | 0.6 /100 | #260 | Tragic 91.4% |
| Taiwanese | 0.6 /100 | #261 | Tragic 91.3% |
| Immigrants | Uruguay | 0.5 /100 | #262 | Tragic 91.3% |
| Immigrants | Ghana | 0.3 /100 | #263 | Tragic 91.2% |
| Yup'ik | 0.3 /100 | #264 | Tragic 91.2% |
| Pueblo | 0.3 /100 | #265 | Tragic 91.2% |
| Immigrants | Western Africa | 0.3 /100 | #266 | Tragic 91.2% |
| Immigrants | Jamaica | 0.3 /100 | #267 | Tragic 91.2% |
Demographics Similar to Immigrants from South Africa by 11th Grade
In terms of 11th grade, the demographic groups most similar to Immigrants from South Africa are Immigrants from England (93.8%, a difference of 0.010%), Immigrants from Japan (93.8%, a difference of 0.030%), Romanian (93.8%, a difference of 0.050%), Immigrants from Czechoslovakia (93.8%, a difference of 0.050%), and Scotch-Irish (93.9%, a difference of 0.060%).
| Demographics | Rating | Rank | 11th Grade |
| Immigrants | Sweden | 99.8 /100 | #64 | Exceptional 93.9% |
| Native Hawaiians | 99.8 /100 | #65 | Exceptional 93.9% |
| Alaskan Athabascans | 99.8 /100 | #66 | Exceptional 93.9% |
| Immigrants | Netherlands | 99.8 /100 | #67 | Exceptional 93.9% |
| Zimbabweans | 99.8 /100 | #68 | Exceptional 93.9% |
| Scotch-Irish | 99.8 /100 | #69 | Exceptional 93.9% |
| Immigrants | England | 99.7 /100 | #70 | Exceptional 93.8% |
| Immigrants | South Africa | 99.7 /100 | #71 | Exceptional 93.8% |
| Immigrants | Japan | 99.7 /100 | #72 | Exceptional 93.8% |
| Romanians | 99.6 /100 | #73 | Exceptional 93.8% |
| Immigrants | Czechoslovakia | 99.6 /100 | #74 | Exceptional 93.8% |
| Immigrants | Latvia | 99.6 /100 | #75 | Exceptional 93.8% |
| Celtics | 99.5 /100 | #76 | Exceptional 93.7% |
| Aleuts | 99.5 /100 | #77 | Exceptional 93.7% |
| Soviet Union | 99.5 /100 | #78 | Exceptional 93.7% |