Navajo vs Immigrants from South Africa 11th Grade
COMPARE
Navajo
Immigrants from South Africa
11th Grade
11th Grade Comparison
Navajo
Immigrants from South Africa
90.0%
11TH GRADE
0.0/ 100
METRIC RATING
297th/ 347
METRIC RANK
93.8%
11TH GRADE
99.7/ 100
METRIC RATING
71st/ 347
METRIC RANK
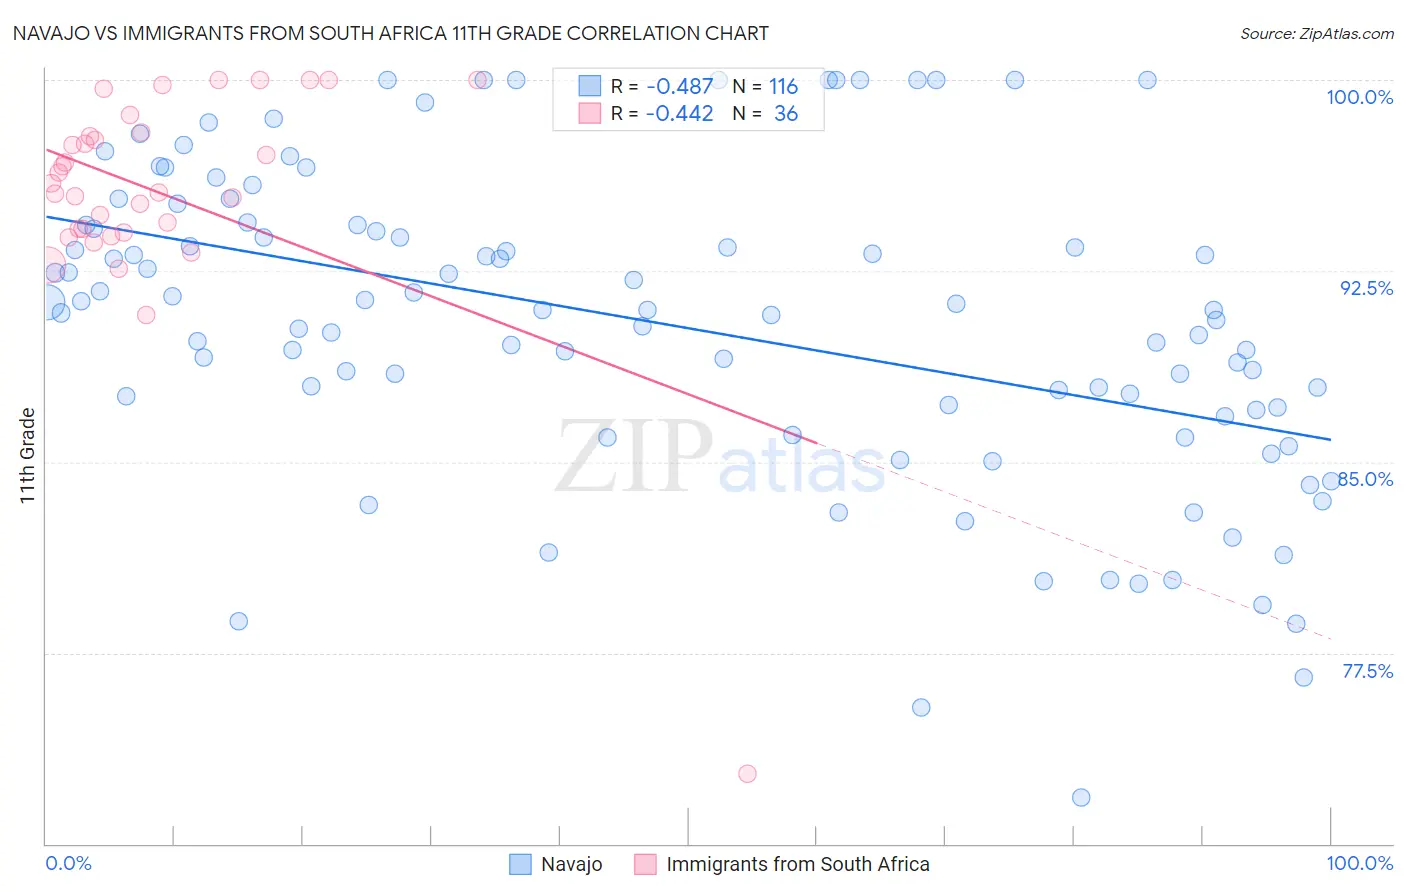
Navajo vs Immigrants from South Africa 11th Grade Correlation Chart
The statistical analysis conducted on geographies consisting of 224,872,858 people shows a moderate negative correlation between the proportion of Navajo and percentage of population with at least 11th grade education in the United States with a correlation coefficient (R) of -0.487 and weighted average of 90.0%. Similarly, the statistical analysis conducted on geographies consisting of 233,321,693 people shows a moderate negative correlation between the proportion of Immigrants from South Africa and percentage of population with at least 11th grade education in the United States with a correlation coefficient (R) of -0.442 and weighted average of 93.8%, a difference of 4.3%.
11th Grade Correlation Summary
| Measurement | Navajo | Immigrants from South Africa |
| Minimum | 71.8% | 72.7% |
| Maximum | 100.0% | 100.0% |
| Range | 28.2% | 27.3% |
| Mean | 90.4% | 95.6% |
| Median | 91.0% | 95.8% |
| Interquartile 25% (IQ1) | 87.1% | 94.1% |
| Interquartile 75% (IQ3) | 94.2% | 97.8% |
| Interquartile Range (IQR) | 7.2% | 3.8% |
| Standard Deviation (Sample) | 6.1% | 4.6% |
| Standard Deviation (Population) | 6.1% | 4.6% |
Similar Demographics by 11th Grade
Demographics Similar to Navajo by 11th Grade
In terms of 11th grade, the demographic groups most similar to Navajo are Fijian (90.0%, a difference of 0.040%), Immigrants from Vietnam (90.0%, a difference of 0.060%), Immigrants from Fiji (89.9%, a difference of 0.070%), Japanese (89.9%, a difference of 0.10%), and Immigrants from Haiti (89.9%, a difference of 0.11%).
| Demographics | Rating | Rank | 11th Grade |
| Indonesians | 0.0 /100 | #290 | Tragic 90.3% |
| Haitians | 0.0 /100 | #291 | Tragic 90.3% |
| Cubans | 0.0 /100 | #292 | Tragic 90.2% |
| Natives/Alaskans | 0.0 /100 | #293 | Tragic 90.2% |
| Immigrants | Grenada | 0.0 /100 | #294 | Tragic 90.1% |
| Immigrants | Vietnam | 0.0 /100 | #295 | Tragic 90.0% |
| Fijians | 0.0 /100 | #296 | Tragic 90.0% |
| Navajo | 0.0 /100 | #297 | Tragic 90.0% |
| Immigrants | Fiji | 0.0 /100 | #298 | Tragic 89.9% |
| Japanese | 0.0 /100 | #299 | Tragic 89.9% |
| Immigrants | Haiti | 0.0 /100 | #300 | Tragic 89.9% |
| Guyanese | 0.0 /100 | #301 | Tragic 89.9% |
| Immigrants | Guyana | 0.0 /100 | #302 | Tragic 89.7% |
| Immigrants | Immigrants | 0.0 /100 | #303 | Tragic 89.7% |
| Yuman | 0.0 /100 | #304 | Tragic 89.7% |
Demographics Similar to Immigrants from South Africa by 11th Grade
In terms of 11th grade, the demographic groups most similar to Immigrants from South Africa are Immigrants from England (93.8%, a difference of 0.010%), Immigrants from Japan (93.8%, a difference of 0.030%), Romanian (93.8%, a difference of 0.050%), Immigrants from Czechoslovakia (93.8%, a difference of 0.050%), and Scotch-Irish (93.9%, a difference of 0.060%).
| Demographics | Rating | Rank | 11th Grade |
| Immigrants | Sweden | 99.8 /100 | #64 | Exceptional 93.9% |
| Native Hawaiians | 99.8 /100 | #65 | Exceptional 93.9% |
| Alaskan Athabascans | 99.8 /100 | #66 | Exceptional 93.9% |
| Immigrants | Netherlands | 99.8 /100 | #67 | Exceptional 93.9% |
| Zimbabweans | 99.8 /100 | #68 | Exceptional 93.9% |
| Scotch-Irish | 99.8 /100 | #69 | Exceptional 93.9% |
| Immigrants | England | 99.7 /100 | #70 | Exceptional 93.8% |
| Immigrants | South Africa | 99.7 /100 | #71 | Exceptional 93.8% |
| Immigrants | Japan | 99.7 /100 | #72 | Exceptional 93.8% |
| Romanians | 99.6 /100 | #73 | Exceptional 93.8% |
| Immigrants | Czechoslovakia | 99.6 /100 | #74 | Exceptional 93.8% |
| Immigrants | Latvia | 99.6 /100 | #75 | Exceptional 93.8% |
| Celtics | 99.5 /100 | #76 | Exceptional 93.7% |
| Aleuts | 99.5 /100 | #77 | Exceptional 93.7% |
| Soviet Union | 99.5 /100 | #78 | Exceptional 93.7% |