South American Indian vs Icelander Nursery School
COMPARE
South American Indian
Icelander
Nursery School
Nursery School Comparison
South American Indians
Icelanders
97.8%
NURSERY SCHOOL
8.0/ 100
METRIC RATING
214th/ 347
METRIC RANK
98.3%
NURSERY SCHOOL
99.2/ 100
METRIC RATING
81st/ 347
METRIC RANK
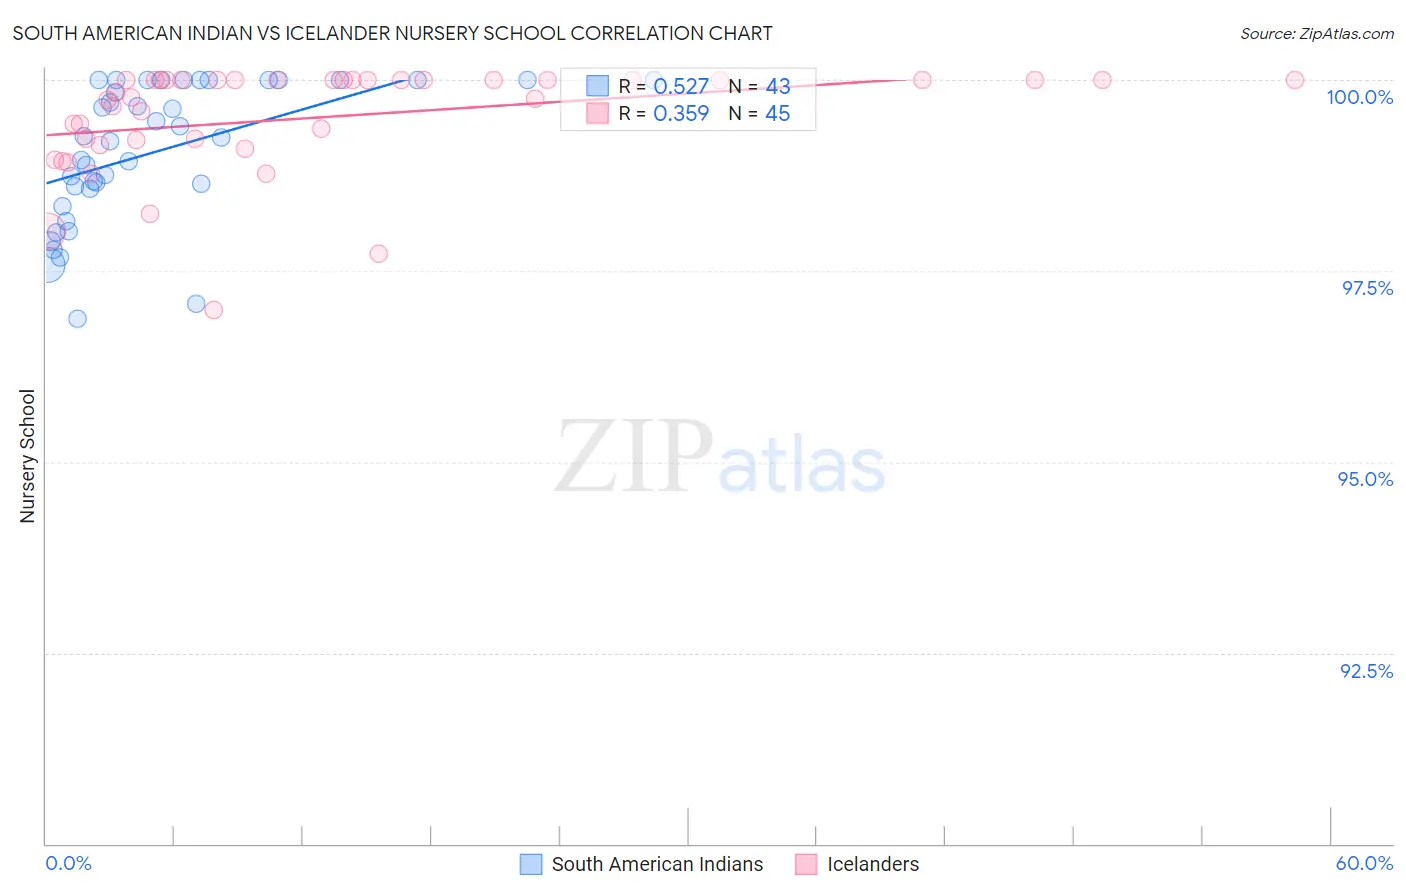
South American Indian vs Icelander Nursery School Correlation Chart
The statistical analysis conducted on geographies consisting of 164,573,401 people shows a substantial positive correlation between the proportion of South American Indians and percentage of population with at least nursery school education in the United States with a correlation coefficient (R) of 0.527 and weighted average of 97.8%. Similarly, the statistical analysis conducted on geographies consisting of 159,668,748 people shows a mild positive correlation between the proportion of Icelanders and percentage of population with at least nursery school education in the United States with a correlation coefficient (R) of 0.359 and weighted average of 98.3%, a difference of 0.55%.
Nursery School Correlation Summary
| Measurement | South American Indian | Icelander |
| Minimum | 96.9% | 97.0% |
| Maximum | 100.0% | 100.0% |
| Range | 3.1% | 3.0% |
| Mean | 99.1% | 99.5% |
| Median | 99.2% | 99.8% |
| Interquartile 25% (IQ1) | 98.6% | 99.2% |
| Interquartile 75% (IQ3) | 100.0% | 100.0% |
| Interquartile Range (IQR) | 1.4% | 0.82% |
| Standard Deviation (Sample) | 0.91% | 0.70% |
| Standard Deviation (Population) | 0.89% | 0.69% |
Similar Demographics by Nursery School
Demographics Similar to South American Indians by Nursery School
In terms of nursery school, the demographic groups most similar to South American Indians are Moroccan (97.8%, a difference of 0.0%), Immigrants from Bahamas (97.8%, a difference of 0.010%), Bahamian (97.8%, a difference of 0.010%), Uruguayan (97.8%, a difference of 0.010%), and Immigrants from Oceania (97.8%, a difference of 0.020%).
| Demographics | Rating | Rank | Nursery School |
| Africans | 15.4 /100 | #207 | Poor 97.9% |
| Immigrants | Northern Africa | 11.7 /100 | #208 | Poor 97.8% |
| Costa Ricans | 11.3 /100 | #209 | Poor 97.8% |
| Immigrants | Oceania | 10.2 /100 | #210 | Poor 97.8% |
| Laotians | 9.8 /100 | #211 | Tragic 97.8% |
| Immigrants | Bahamas | 8.6 /100 | #212 | Tragic 97.8% |
| Moroccans | 8.3 /100 | #213 | Tragic 97.8% |
| South American Indians | 8.0 /100 | #214 | Tragic 97.8% |
| Bahamians | 7.4 /100 | #215 | Tragic 97.8% |
| Uruguayans | 7.1 /100 | #216 | Tragic 97.8% |
| Samoans | 6.3 /100 | #217 | Tragic 97.8% |
| Immigrants | Panama | 5.3 /100 | #218 | Tragic 97.8% |
| Immigrants | Morocco | 5.1 /100 | #219 | Tragic 97.8% |
| Immigrants | Zaire | 4.4 /100 | #220 | Tragic 97.8% |
| Tongans | 4.3 /100 | #221 | Tragic 97.8% |
Demographics Similar to Icelanders by Nursery School
In terms of nursery school, the demographic groups most similar to Icelanders are Delaware (98.3%, a difference of 0.0%), Immigrants from Belgium (98.3%, a difference of 0.0%), Shoshone (98.3%, a difference of 0.0%), Potawatomi (98.3%, a difference of 0.0%), and Immigrants from Netherlands (98.4%, a difference of 0.010%).
| Demographics | Rating | Rank | Nursery School |
| Immigrants | Netherlands | 99.4 /100 | #74 | Exceptional 98.4% |
| Cherokee | 99.3 /100 | #75 | Exceptional 98.3% |
| Immigrants | England | 99.3 /100 | #76 | Exceptional 98.3% |
| Immigrants | Lithuania | 99.3 /100 | #77 | Exceptional 98.3% |
| Delaware | 99.3 /100 | #78 | Exceptional 98.3% |
| Immigrants | Belgium | 99.3 /100 | #79 | Exceptional 98.3% |
| Shoshone | 99.3 /100 | #80 | Exceptional 98.3% |
| Icelanders | 99.2 /100 | #81 | Exceptional 98.3% |
| Potawatomi | 99.2 /100 | #82 | Exceptional 98.3% |
| Osage | 99.1 /100 | #83 | Exceptional 98.3% |
| Immigrants | Denmark | 99.1 /100 | #84 | Exceptional 98.3% |
| Immigrants | Sweden | 99.1 /100 | #85 | Exceptional 98.3% |
| Immigrants | Australia | 99.0 /100 | #86 | Exceptional 98.3% |
| Hopi | 98.9 /100 | #87 | Exceptional 98.3% |
| Ukrainians | 98.9 /100 | #88 | Exceptional 98.3% |