South American Indian vs Icelander 9th Grade
COMPARE
South American Indian
Icelander
9th Grade
9th Grade Comparison
South American Indians
Icelanders
94.3%
9TH GRADE
2.8/ 100
METRIC RATING
238th/ 347
METRIC RANK
95.7%
9TH GRADE
99.1/ 100
METRIC RATING
85th/ 347
METRIC RANK
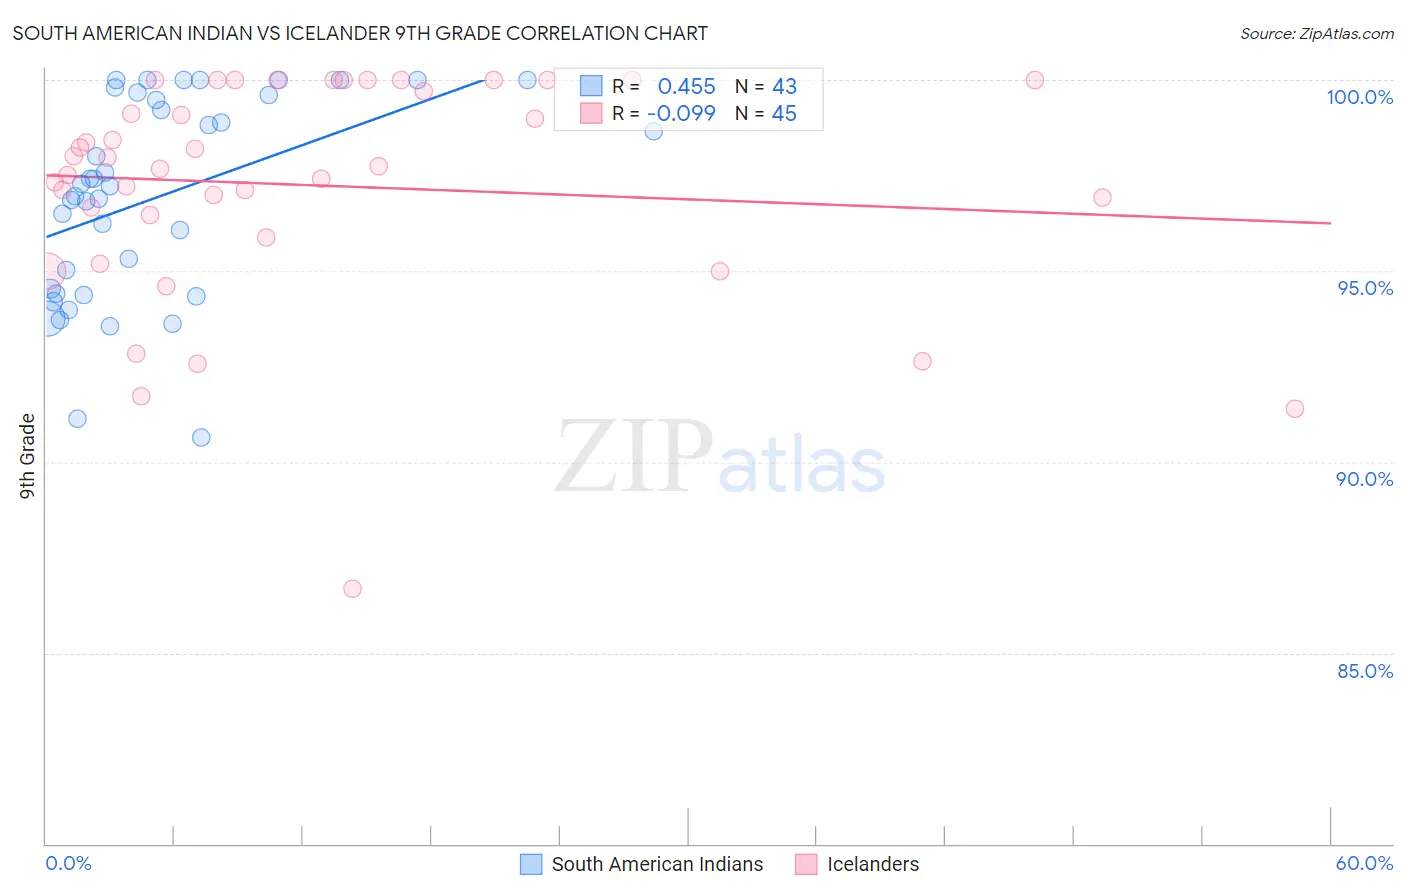
South American Indian vs Icelander 9th Grade Correlation Chart
The statistical analysis conducted on geographies consisting of 164,573,401 people shows a moderate positive correlation between the proportion of South American Indians and percentage of population with at least 9th grade education in the United States with a correlation coefficient (R) of 0.455 and weighted average of 94.3%. Similarly, the statistical analysis conducted on geographies consisting of 159,667,064 people shows a slight negative correlation between the proportion of Icelanders and percentage of population with at least 9th grade education in the United States with a correlation coefficient (R) of -0.099 and weighted average of 95.7%, a difference of 1.5%.
9th Grade Correlation Summary
| Measurement | South American Indian | Icelander |
| Minimum | 90.6% | 86.7% |
| Maximum | 100.0% | 100.0% |
| Range | 9.4% | 13.3% |
| Mean | 96.9% | 97.2% |
| Median | 97.2% | 97.7% |
| Interquartile 25% (IQ1) | 94.4% | 96.2% |
| Interquartile 75% (IQ3) | 99.6% | 100.0% |
| Interquartile Range (IQR) | 5.2% | 3.8% |
| Standard Deviation (Sample) | 2.6% | 2.9% |
| Standard Deviation (Population) | 2.6% | 2.9% |
Similar Demographics by 9th Grade
Demographics Similar to South American Indians by 9th Grade
In terms of 9th grade, the demographic groups most similar to South American Indians are Korean (94.3%, a difference of 0.0%), Immigrants from China (94.3%, a difference of 0.0%), Somali (94.3%, a difference of 0.010%), Immigrants from Ethiopia (94.3%, a difference of 0.010%), and Spanish American (94.2%, a difference of 0.010%).
| Demographics | Rating | Rank | 9th Grade |
| Immigrants | Panama | 4.0 /100 | #231 | Tragic 94.3% |
| Immigrants | Africa | 3.9 /100 | #232 | Tragic 94.3% |
| Nigerians | 3.7 /100 | #233 | Tragic 94.3% |
| Costa Ricans | 3.5 /100 | #234 | Tragic 94.3% |
| Bolivians | 3.3 /100 | #235 | Tragic 94.3% |
| Somalis | 2.9 /100 | #236 | Tragic 94.3% |
| Koreans | 2.9 /100 | #237 | Tragic 94.3% |
| South American Indians | 2.8 /100 | #238 | Tragic 94.3% |
| Immigrants | China | 2.8 /100 | #239 | Tragic 94.3% |
| Immigrants | Ethiopia | 2.7 /100 | #240 | Tragic 94.3% |
| Spanish Americans | 2.6 /100 | #241 | Tragic 94.2% |
| Immigrants | Middle Africa | 2.2 /100 | #242 | Tragic 94.2% |
| Immigrants | Cameroon | 2.1 /100 | #243 | Tragic 94.2% |
| Dutch West Indians | 2.0 /100 | #244 | Tragic 94.2% |
| Paiute | 1.9 /100 | #245 | Tragic 94.2% |
Demographics Similar to Icelanders by 9th Grade
In terms of 9th grade, the demographic groups most similar to Icelanders are Immigrants from Denmark (95.7%, a difference of 0.0%), Immigrants from Western Europe (95.7%, a difference of 0.0%), Swiss (95.7%, a difference of 0.010%), Bhutanese (95.7%, a difference of 0.030%), and Arapaho (95.7%, a difference of 0.030%).
| Demographics | Rating | Rank | 9th Grade |
| Immigrants | South Africa | 99.4 /100 | #78 | Exceptional 95.8% |
| Romanians | 99.3 /100 | #79 | Exceptional 95.7% |
| Bhutanese | 99.3 /100 | #80 | Exceptional 95.7% |
| Arapaho | 99.3 /100 | #81 | Exceptional 95.7% |
| Puget Sound Salish | 99.2 /100 | #82 | Exceptional 95.7% |
| Swiss | 99.2 /100 | #83 | Exceptional 95.7% |
| Immigrants | Denmark | 99.1 /100 | #84 | Exceptional 95.7% |
| Icelanders | 99.1 /100 | #85 | Exceptional 95.7% |
| Immigrants | Western Europe | 99.1 /100 | #86 | Exceptional 95.7% |
| Okinawans | 99.0 /100 | #87 | Exceptional 95.7% |
| Immigrants | Czechoslovakia | 98.9 /100 | #88 | Exceptional 95.7% |
| Yugoslavians | 98.9 /100 | #89 | Exceptional 95.7% |
| South Africans | 98.8 /100 | #90 | Exceptional 95.6% |
| Creek | 98.8 /100 | #91 | Exceptional 95.6% |
| Immigrants | Saudi Arabia | 98.8 /100 | #92 | Exceptional 95.6% |