Slovene vs Sudanese College, 1 year or more
COMPARE
Slovene
Sudanese
College, 1 year or more
College, 1 year or more Comparison
Slovenes
Sudanese
60.9%
COLLEGE, 1 YEAR OR MORE
86.5/ 100
METRIC RATING
137th/ 347
METRIC RANK
60.2%
COLLEGE, 1 YEAR OR MORE
73.0/ 100
METRIC RATING
154th/ 347
METRIC RANK
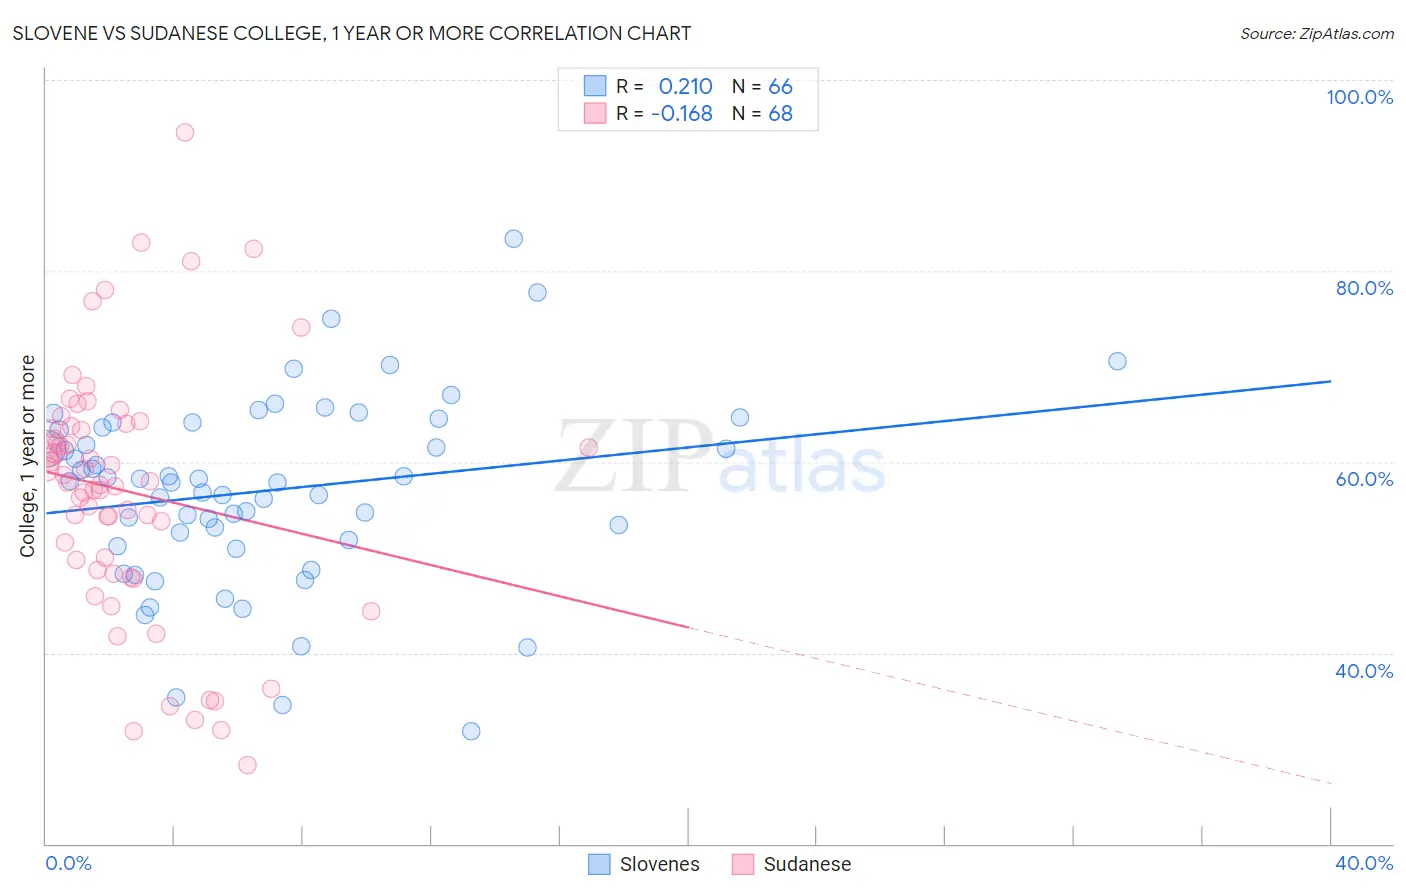
Slovene vs Sudanese College, 1 year or more Correlation Chart
The statistical analysis conducted on geographies consisting of 261,353,489 people shows a weak positive correlation between the proportion of Slovenes and percentage of population with at least college, 1 year or more education in the United States with a correlation coefficient (R) of 0.210 and weighted average of 60.9%. Similarly, the statistical analysis conducted on geographies consisting of 110,147,806 people shows a poor negative correlation between the proportion of Sudanese and percentage of population with at least college, 1 year or more education in the United States with a correlation coefficient (R) of -0.168 and weighted average of 60.2%, a difference of 1.1%.
College, 1 year or more Correlation Summary
| Measurement | Slovene | Sudanese |
| Minimum | 31.8% | 28.3% |
| Maximum | 83.3% | 94.5% |
| Range | 51.5% | 66.2% |
| Mean | 57.0% | 56.9% |
| Median | 57.9% | 57.9% |
| Interquartile 25% (IQ1) | 51.8% | 49.2% |
| Interquartile 75% (IQ3) | 63.6% | 63.6% |
| Interquartile Range (IQR) | 11.8% | 14.4% |
| Standard Deviation (Sample) | 9.8% | 13.1% |
| Standard Deviation (Population) | 9.7% | 13.0% |
Demographics Similar to Slovenes and Sudanese by College, 1 year or more
In terms of college, 1 year or more, the demographic groups most similar to Slovenes are Basque (60.9%, a difference of 0.090%), Immigrants from Uganda (60.9%, a difference of 0.11%), Taiwanese (60.7%, a difference of 0.22%), Immigrants from Eritrea (60.7%, a difference of 0.22%), and Iraqi (60.7%, a difference of 0.32%). Similarly, the demographic groups most similar to Sudanese are Moroccan (60.2%, a difference of 0.0%), Sierra Leonean (60.2%, a difference of 0.080%), Immigrants from Germany (60.3%, a difference of 0.22%), Immigrants from Sudan (60.4%, a difference of 0.35%), and Albanian (60.4%, a difference of 0.35%).
| Demographics | Rating | Rank | College, 1 year or more |
| Immigrants | Uganda | 87.4 /100 | #135 | Excellent 60.9% |
| Basques | 87.2 /100 | #136 | Excellent 60.9% |
| Slovenes | 86.5 /100 | #137 | Excellent 60.9% |
| Taiwanese | 84.3 /100 | #138 | Excellent 60.7% |
| Immigrants | Eritrea | 84.3 /100 | #139 | Excellent 60.7% |
| Iraqis | 83.3 /100 | #140 | Excellent 60.7% |
| Immigrants | Afghanistan | 83.1 /100 | #141 | Excellent 60.7% |
| Poles | 82.8 /100 | #142 | Excellent 60.7% |
| Canadians | 82.7 /100 | #143 | Excellent 60.6% |
| Czechs | 81.9 /100 | #144 | Excellent 60.6% |
| Slavs | 81.1 /100 | #145 | Excellent 60.6% |
| Scottish | 80.2 /100 | #146 | Excellent 60.5% |
| Immigrants | Kenya | 79.1 /100 | #147 | Good 60.5% |
| Kenyans | 79.0 /100 | #148 | Good 60.5% |
| Brazilians | 79.0 /100 | #149 | Good 60.5% |
| Immigrants | Sudan | 77.8 /100 | #150 | Good 60.4% |
| Albanians | 77.8 /100 | #151 | Good 60.4% |
| Immigrants | Germany | 76.1 /100 | #152 | Good 60.3% |
| Sierra Leoneans | 74.1 /100 | #153 | Good 60.2% |
| Sudanese | 73.0 /100 | #154 | Good 60.2% |
| Moroccans | 72.9 /100 | #155 | Good 60.2% |