Slovene vs Cypriot GED/Equivalency
COMPARE
Slovene
Cypriot
GED/Equivalency
GED/Equivalency Comparison
Slovenes
Cypriots
88.8%
GED/EQUIVALENCY
99.9/ 100
METRIC RATING
18th/ 347
METRIC RANK
88.9%
GED/EQUIVALENCY
99.9/ 100
METRIC RATING
14th/ 347
METRIC RANK
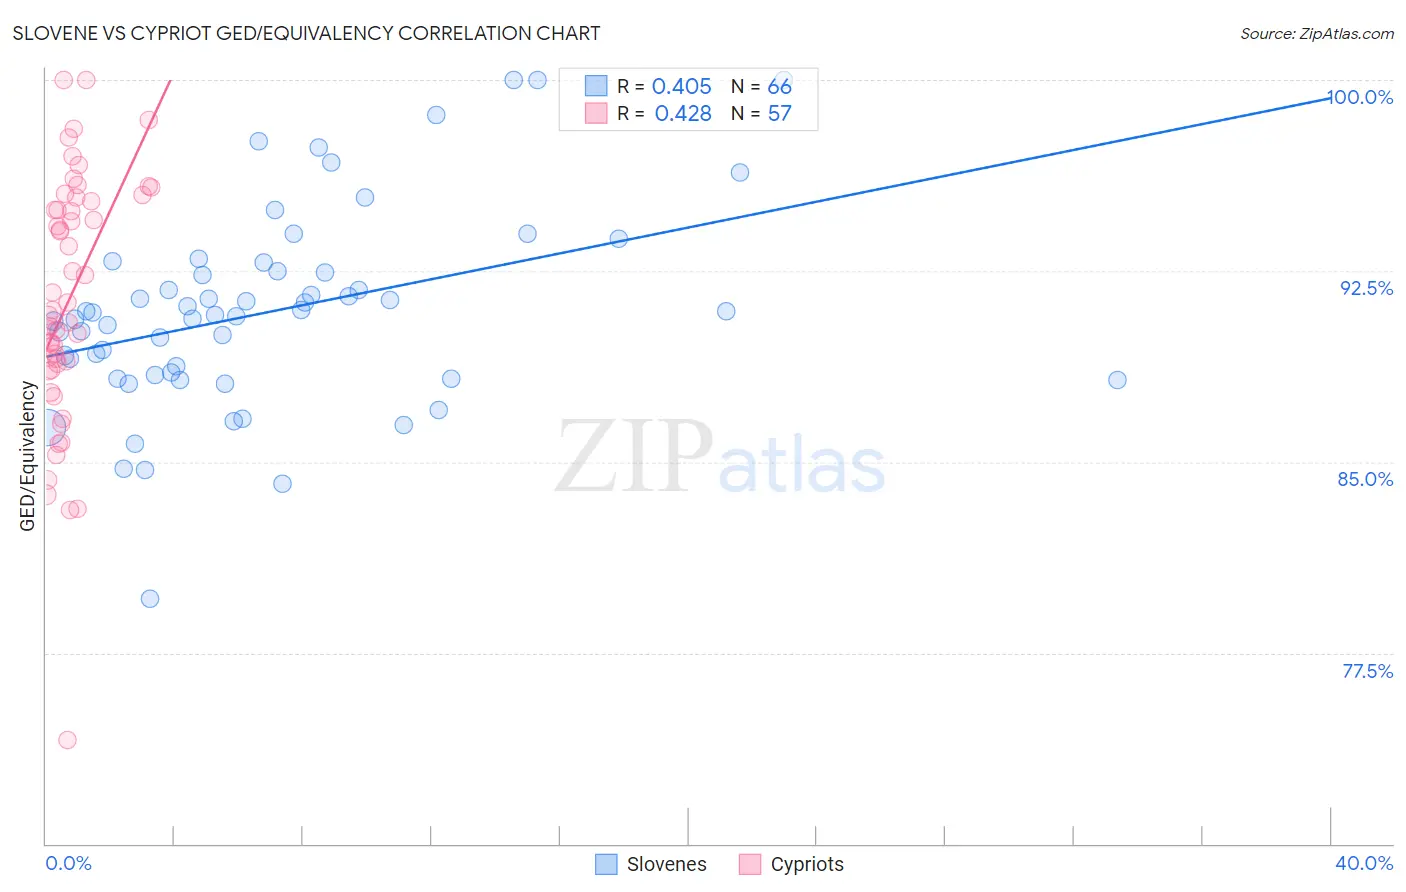
Slovene vs Cypriot GED/Equivalency Correlation Chart
The statistical analysis conducted on geographies consisting of 261,353,399 people shows a moderate positive correlation between the proportion of Slovenes and percentage of population with at least ged/equivalency education in the United States with a correlation coefficient (R) of 0.405 and weighted average of 88.8%. Similarly, the statistical analysis conducted on geographies consisting of 61,870,289 people shows a moderate positive correlation between the proportion of Cypriots and percentage of population with at least ged/equivalency education in the United States with a correlation coefficient (R) of 0.428 and weighted average of 88.9%, a difference of 0.11%.
GED/Equivalency Correlation Summary
| Measurement | Slovene | Cypriot |
| Minimum | 79.6% | 74.1% |
| Maximum | 100.0% | 100.0% |
| Range | 20.4% | 25.9% |
| Mean | 90.9% | 91.4% |
| Median | 90.8% | 90.9% |
| Interquartile 25% (IQ1) | 88.4% | 88.7% |
| Interquartile 75% (IQ3) | 92.5% | 95.3% |
| Interquartile Range (IQR) | 4.1% | 6.6% |
| Standard Deviation (Sample) | 3.9% | 4.9% |
| Standard Deviation (Population) | 3.9% | 4.9% |
Demographics Similar to Slovenes and Cypriots by GED/Equivalency
In terms of ged/equivalency, the demographic groups most similar to Slovenes are Croatian (88.8%, a difference of 0.030%), Swedish (88.8%, a difference of 0.050%), Immigrants from Taiwan (88.8%, a difference of 0.060%), Okinawan (88.9%, a difference of 0.090%), and Immigrants from Iran (88.9%, a difference of 0.14%). Similarly, the demographic groups most similar to Cypriots are Okinawan (88.9%, a difference of 0.020%), Immigrants from Iran (88.9%, a difference of 0.030%), Lithuanian (88.9%, a difference of 0.040%), Immigrants from Taiwan (88.8%, a difference of 0.050%), and Bulgarian (89.0%, a difference of 0.080%).
| Demographics | Rating | Rank | GED/Equivalency |
| Thais | 100.0 /100 | #6 | Exceptional 89.1% |
| Eastern Europeans | 99.9 /100 | #7 | Exceptional 89.1% |
| Carpatho Rusyns | 99.9 /100 | #8 | Exceptional 89.1% |
| Chinese | 99.9 /100 | #9 | Exceptional 89.0% |
| Norwegians | 99.9 /100 | #10 | Exceptional 89.0% |
| Bulgarians | 99.9 /100 | #11 | Exceptional 89.0% |
| Lithuanians | 99.9 /100 | #12 | Exceptional 88.9% |
| Immigrants | Iran | 99.9 /100 | #13 | Exceptional 88.9% |
| Cypriots | 99.9 /100 | #14 | Exceptional 88.9% |
| Okinawans | 99.9 /100 | #15 | Exceptional 88.9% |
| Immigrants | Taiwan | 99.9 /100 | #16 | Exceptional 88.8% |
| Croatians | 99.9 /100 | #17 | Exceptional 88.8% |
| Slovenes | 99.9 /100 | #18 | Exceptional 88.8% |
| Swedes | 99.9 /100 | #19 | Exceptional 88.8% |
| Maltese | 99.9 /100 | #20 | Exceptional 88.6% |
| Luxembourgers | 99.8 /100 | #21 | Exceptional 88.6% |
| Immigrants | Ireland | 99.8 /100 | #22 | Exceptional 88.6% |
| Russians | 99.8 /100 | #23 | Exceptional 88.6% |
| Slovaks | 99.8 /100 | #24 | Exceptional 88.6% |
| Estonians | 99.8 /100 | #25 | Exceptional 88.6% |
| Immigrants | Australia | 99.8 /100 | #26 | Exceptional 88.6% |