Sierra Leonean vs South African Bachelor's Degree
COMPARE
Sierra Leonean
South African
Bachelor's Degree
Bachelor's Degree Comparison
Sierra Leoneans
South Africans
40.1%
BACHELOR'S DEGREE
92.2/ 100
METRIC RATING
130th/ 347
METRIC RANK
43.6%
BACHELOR'S DEGREE
99.8/ 100
METRIC RATING
61st/ 347
METRIC RANK
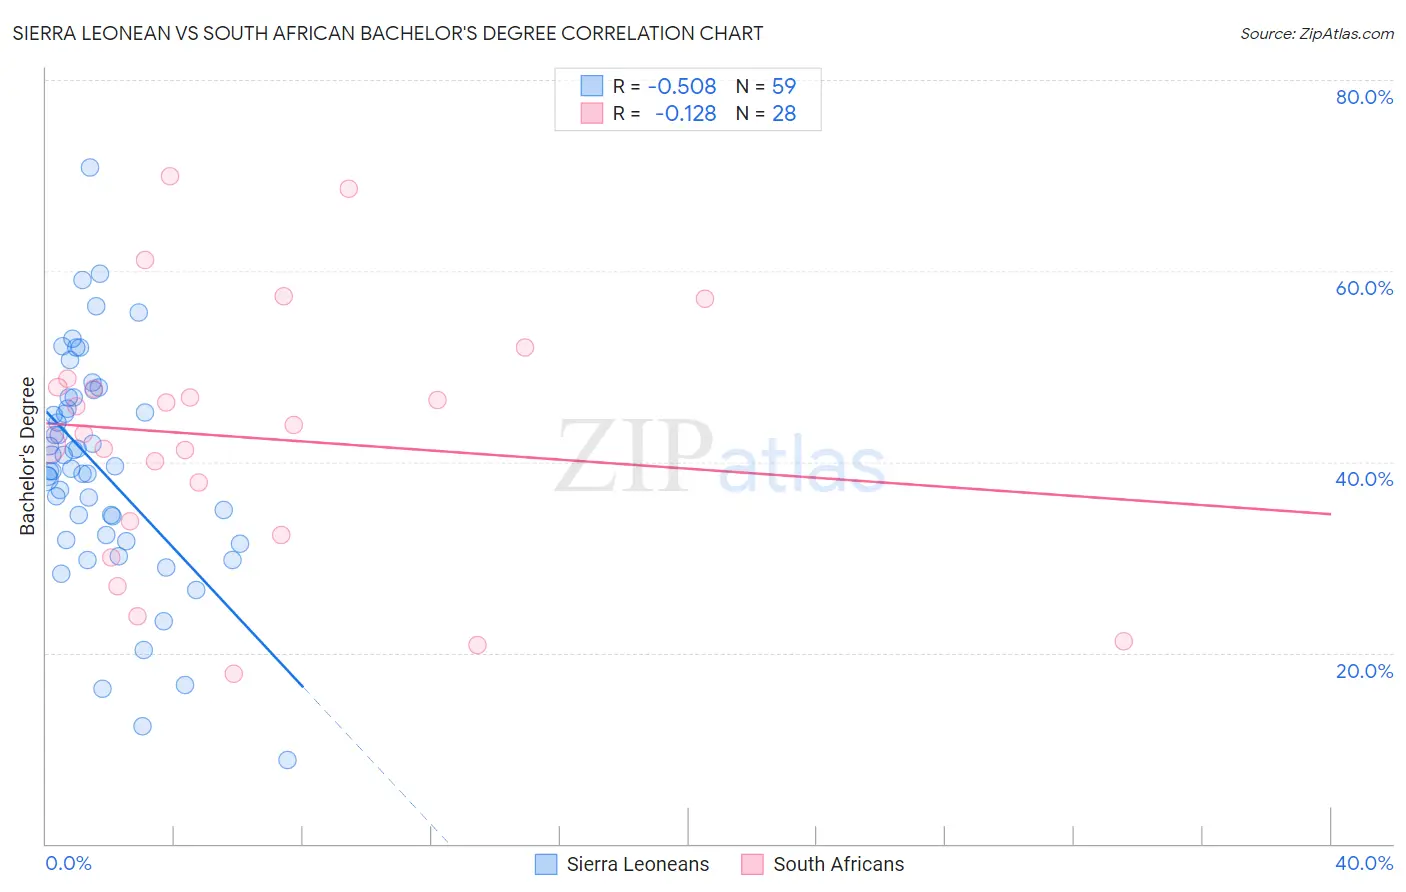
Sierra Leonean vs South African Bachelor's Degree Correlation Chart
The statistical analysis conducted on geographies consisting of 83,362,711 people shows a substantial negative correlation between the proportion of Sierra Leoneans and percentage of population with at least bachelor's degree education in the United States with a correlation coefficient (R) of -0.508 and weighted average of 40.1%. Similarly, the statistical analysis conducted on geographies consisting of 182,590,093 people shows a poor negative correlation between the proportion of South Africans and percentage of population with at least bachelor's degree education in the United States with a correlation coefficient (R) of -0.128 and weighted average of 43.6%, a difference of 8.6%.
Bachelor's Degree Correlation Summary
| Measurement | Sierra Leonean | South African |
| Minimum | 8.8% | 17.8% |
| Maximum | 70.8% | 69.9% |
| Range | 62.1% | 52.1% |
| Mean | 39.2% | 42.6% |
| Median | 39.3% | 43.4% |
| Interquartile 25% (IQ1) | 31.8% | 33.1% |
| Interquartile 75% (IQ3) | 46.8% | 48.3% |
| Interquartile Range (IQR) | 15.0% | 15.2% |
| Standard Deviation (Sample) | 11.8% | 13.5% |
| Standard Deviation (Population) | 11.7% | 13.3% |
Similar Demographics by Bachelor's Degree
Demographics Similar to Sierra Leoneans by Bachelor's Degree
In terms of bachelor's degree, the demographic groups most similar to Sierra Leoneans are Serbian (40.1%, a difference of 0.070%), Italian (40.1%, a difference of 0.080%), Immigrants from Venezuela (40.2%, a difference of 0.24%), Taiwanese (40.0%, a difference of 0.33%), and Immigrants from Southern Europe (40.0%, a difference of 0.33%).
| Demographics | Rating | Rank | Bachelor's Degree |
| Lebanese | 94.3 /100 | #123 | Exceptional 40.4% |
| Immigrants | Eritrea | 94.3 /100 | #124 | Exceptional 40.4% |
| British | 94.2 /100 | #125 | Exceptional 40.4% |
| Immigrants | Eastern Africa | 94.1 /100 | #126 | Exceptional 40.4% |
| Immigrants | Jordan | 93.4 /100 | #127 | Exceptional 40.3% |
| Immigrants | Venezuela | 92.9 /100 | #128 | Exceptional 40.2% |
| Serbians | 92.4 /100 | #129 | Exceptional 40.1% |
| Sierra Leoneans | 92.2 /100 | #130 | Exceptional 40.1% |
| Italians | 91.9 /100 | #131 | Exceptional 40.1% |
| Taiwanese | 91.1 /100 | #132 | Exceptional 40.0% |
| Immigrants | Southern Europe | 91.1 /100 | #133 | Exceptional 40.0% |
| Assyrians/Chaldeans/Syriacs | 89.4 /100 | #134 | Excellent 39.8% |
| Luxembourgers | 89.1 /100 | #135 | Excellent 39.8% |
| Pakistanis | 88.2 /100 | #136 | Excellent 39.7% |
| Icelanders | 86.5 /100 | #137 | Excellent 39.5% |
Demographics Similar to South Africans by Bachelor's Degree
In terms of bachelor's degree, the demographic groups most similar to South Africans are Immigrants from Kazakhstan (43.4%, a difference of 0.30%), Immigrants from Europe (43.4%, a difference of 0.34%), Argentinean (43.3%, a difference of 0.62%), Zimbabwean (43.3%, a difference of 0.62%), and Immigrants from Netherlands (43.3%, a difference of 0.64%).
| Demographics | Rating | Rank | Bachelor's Degree |
| Immigrants | Austria | 99.9 /100 | #54 | Exceptional 44.2% |
| Immigrants | Bolivia | 99.9 /100 | #55 | Exceptional 44.2% |
| Immigrants | Serbia | 99.9 /100 | #56 | Exceptional 44.1% |
| Paraguayans | 99.9 /100 | #57 | Exceptional 44.0% |
| Immigrants | Czechoslovakia | 99.9 /100 | #58 | Exceptional 44.0% |
| Australians | 99.9 /100 | #59 | Exceptional 44.0% |
| New Zealanders | 99.9 /100 | #60 | Exceptional 44.0% |
| South Africans | 99.8 /100 | #61 | Exceptional 43.6% |
| Immigrants | Kazakhstan | 99.8 /100 | #62 | Exceptional 43.4% |
| Immigrants | Europe | 99.8 /100 | #63 | Exceptional 43.4% |
| Argentineans | 99.7 /100 | #64 | Exceptional 43.3% |
| Zimbabweans | 99.7 /100 | #65 | Exceptional 43.3% |
| Immigrants | Netherlands | 99.7 /100 | #66 | Exceptional 43.3% |
| Egyptians | 99.7 /100 | #67 | Exceptional 43.3% |
| Immigrants | Indonesia | 99.7 /100 | #68 | Exceptional 43.3% |