Sierra Leonean vs Chippewa Bachelor's Degree
COMPARE
Sierra Leonean
Chippewa
Bachelor's Degree
Bachelor's Degree Comparison
Sierra Leoneans
Chippewa
40.1%
BACHELOR'S DEGREE
92.2/ 100
METRIC RATING
130th/ 347
METRIC RANK
30.6%
BACHELOR'S DEGREE
0.0/ 100
METRIC RATING
298th/ 347
METRIC RANK
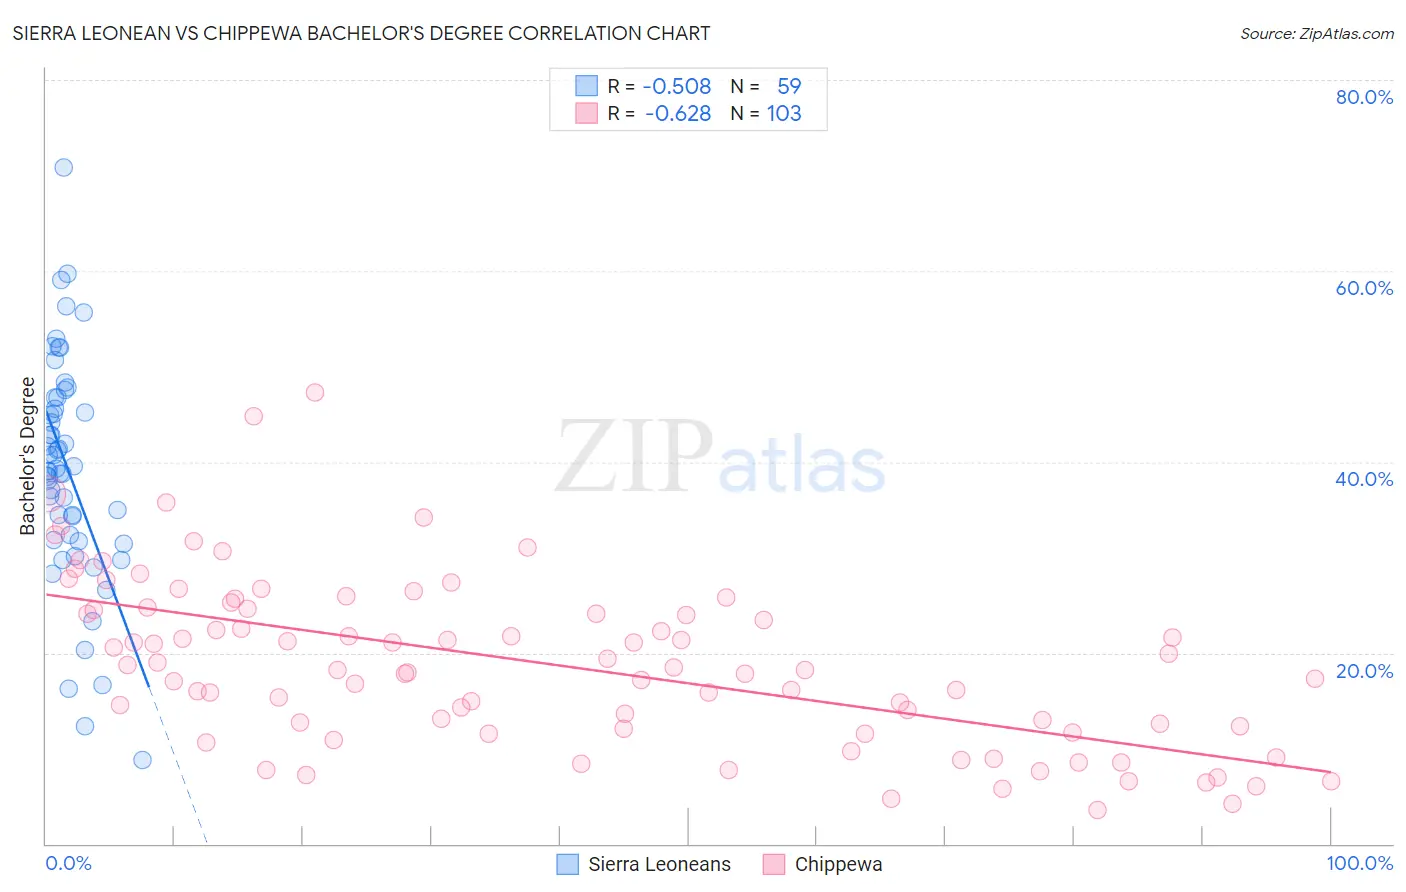
Sierra Leonean vs Chippewa Bachelor's Degree Correlation Chart
The statistical analysis conducted on geographies consisting of 83,362,711 people shows a substantial negative correlation between the proportion of Sierra Leoneans and percentage of population with at least bachelor's degree education in the United States with a correlation coefficient (R) of -0.508 and weighted average of 40.1%. Similarly, the statistical analysis conducted on geographies consisting of 215,055,774 people shows a significant negative correlation between the proportion of Chippewa and percentage of population with at least bachelor's degree education in the United States with a correlation coefficient (R) of -0.628 and weighted average of 30.6%, a difference of 31.2%.
Bachelor's Degree Correlation Summary
| Measurement | Sierra Leonean | Chippewa |
| Minimum | 8.8% | 3.6% |
| Maximum | 70.8% | 47.3% |
| Range | 62.1% | 43.7% |
| Mean | 39.2% | 18.8% |
| Median | 39.3% | 18.2% |
| Interquartile 25% (IQ1) | 31.8% | 12.0% |
| Interquartile 75% (IQ3) | 46.8% | 24.6% |
| Interquartile Range (IQR) | 15.0% | 12.6% |
| Standard Deviation (Sample) | 11.8% | 8.9% |
| Standard Deviation (Population) | 11.7% | 8.8% |
Similar Demographics by Bachelor's Degree
Demographics Similar to Sierra Leoneans by Bachelor's Degree
In terms of bachelor's degree, the demographic groups most similar to Sierra Leoneans are Serbian (40.1%, a difference of 0.070%), Italian (40.1%, a difference of 0.080%), Immigrants from Venezuela (40.2%, a difference of 0.24%), Taiwanese (40.0%, a difference of 0.33%), and Immigrants from Southern Europe (40.0%, a difference of 0.33%).
| Demographics | Rating | Rank | Bachelor's Degree |
| Lebanese | 94.3 /100 | #123 | Exceptional 40.4% |
| Immigrants | Eritrea | 94.3 /100 | #124 | Exceptional 40.4% |
| British | 94.2 /100 | #125 | Exceptional 40.4% |
| Immigrants | Eastern Africa | 94.1 /100 | #126 | Exceptional 40.4% |
| Immigrants | Jordan | 93.4 /100 | #127 | Exceptional 40.3% |
| Immigrants | Venezuela | 92.9 /100 | #128 | Exceptional 40.2% |
| Serbians | 92.4 /100 | #129 | Exceptional 40.1% |
| Sierra Leoneans | 92.2 /100 | #130 | Exceptional 40.1% |
| Italians | 91.9 /100 | #131 | Exceptional 40.1% |
| Taiwanese | 91.1 /100 | #132 | Exceptional 40.0% |
| Immigrants | Southern Europe | 91.1 /100 | #133 | Exceptional 40.0% |
| Assyrians/Chaldeans/Syriacs | 89.4 /100 | #134 | Excellent 39.8% |
| Luxembourgers | 89.1 /100 | #135 | Excellent 39.8% |
| Pakistanis | 88.2 /100 | #136 | Excellent 39.7% |
| Icelanders | 86.5 /100 | #137 | Excellent 39.5% |
Demographics Similar to Chippewa by Bachelor's Degree
In terms of bachelor's degree, the demographic groups most similar to Chippewa are Immigrants from Haiti (30.6%, a difference of 0.25%), Puget Sound Salish (30.7%, a difference of 0.31%), Immigrants from Dominican Republic (30.7%, a difference of 0.41%), Chickasaw (30.4%, a difference of 0.52%), and Immigrants from Micronesia (30.4%, a difference of 0.54%).
| Demographics | Rating | Rank | Bachelor's Degree |
| Blacks/African Americans | 0.1 /100 | #291 | Tragic 30.9% |
| Ute | 0.1 /100 | #292 | Tragic 30.9% |
| Cape Verdeans | 0.1 /100 | #293 | Tragic 30.9% |
| Immigrants | Guatemala | 0.0 /100 | #294 | Tragic 30.8% |
| Immigrants | Dominican Republic | 0.0 /100 | #295 | Tragic 30.7% |
| Puget Sound Salish | 0.0 /100 | #296 | Tragic 30.7% |
| Immigrants | Haiti | 0.0 /100 | #297 | Tragic 30.6% |
| Chippewa | 0.0 /100 | #298 | Tragic 30.6% |
| Chickasaw | 0.0 /100 | #299 | Tragic 30.4% |
| Immigrants | Micronesia | 0.0 /100 | #300 | Tragic 30.4% |
| Immigrants | Cuba | 0.0 /100 | #301 | Tragic 30.3% |
| Mexican American Indians | 0.0 /100 | #302 | Tragic 30.2% |
| Bangladeshis | 0.0 /100 | #303 | Tragic 30.2% |
| Cherokee | 0.0 /100 | #304 | Tragic 30.2% |
| Immigrants | Latin America | 0.0 /100 | #305 | Tragic 30.1% |