Sierra Leonean vs Immigrants from North Macedonia College, Under 1 year
COMPARE
Sierra Leonean
Immigrants from North Macedonia
College, Under 1 year
College, Under 1 year Comparison
Sierra Leoneans
Immigrants from North Macedonia
66.0%
COLLEGE, UNDER 1 YEAR
67.8/ 100
METRIC RATING
157th/ 347
METRIC RANK
65.4%
COLLEGE, UNDER 1 YEAR
48.6/ 100
METRIC RATING
177th/ 347
METRIC RANK
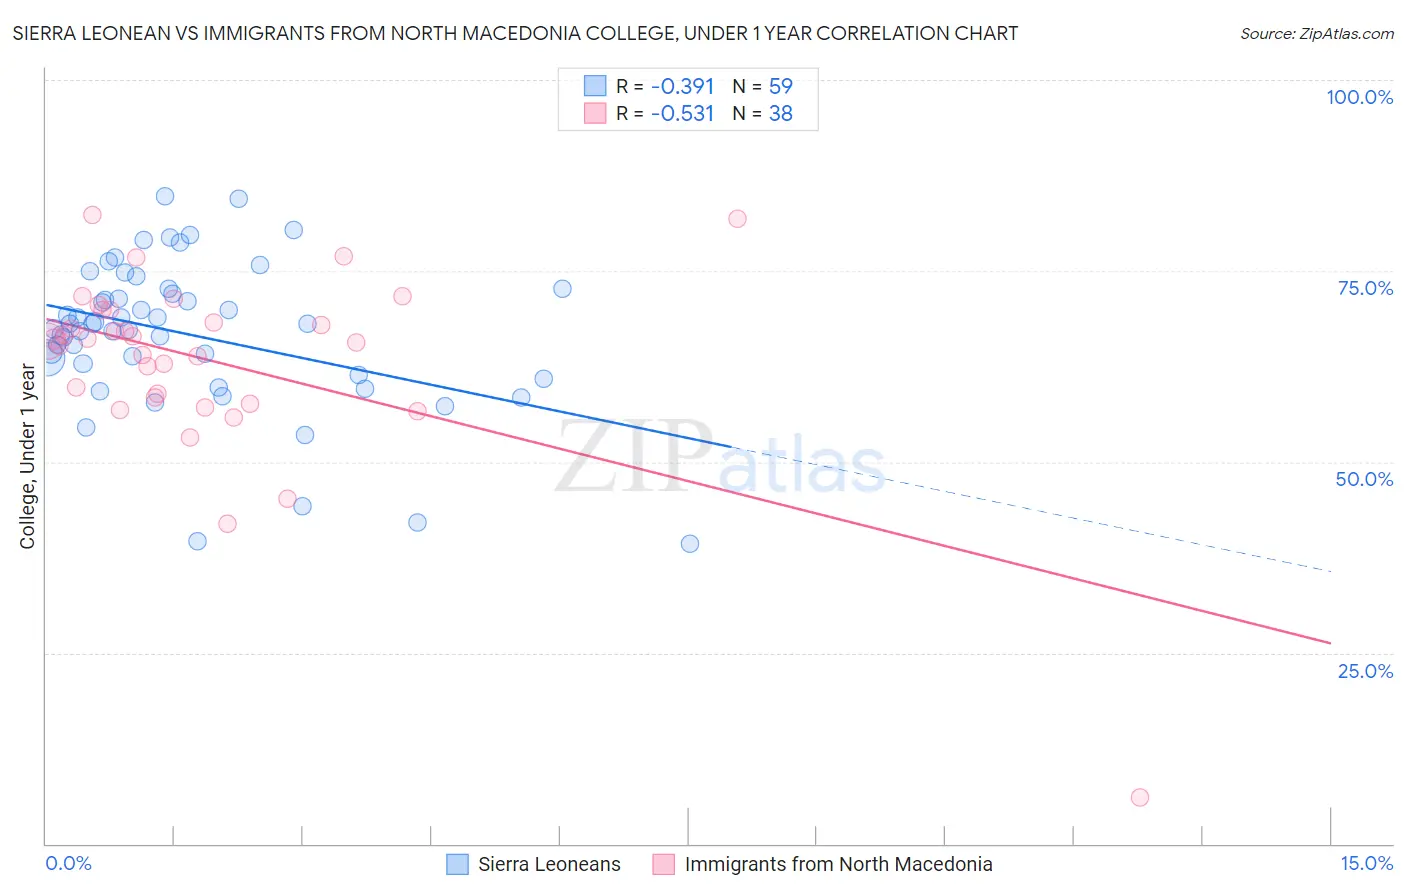
Sierra Leonean vs Immigrants from North Macedonia College, Under 1 year Correlation Chart
The statistical analysis conducted on geographies consisting of 83,362,711 people shows a mild negative correlation between the proportion of Sierra Leoneans and percentage of population with at least college, under 1 year education in the United States with a correlation coefficient (R) of -0.391 and weighted average of 66.0%. Similarly, the statistical analysis conducted on geographies consisting of 74,317,186 people shows a substantial negative correlation between the proportion of Immigrants from North Macedonia and percentage of population with at least college, under 1 year education in the United States with a correlation coefficient (R) of -0.531 and weighted average of 65.4%, a difference of 0.88%.
College, Under 1 year Correlation Summary
| Measurement | Sierra Leonean | Immigrants from North Macedonia |
| Minimum | 39.3% | 6.0% |
| Maximum | 84.7% | 82.4% |
| Range | 45.5% | 76.3% |
| Mean | 66.7% | 63.2% |
| Median | 68.1% | 65.9% |
| Interquartile 25% (IQ1) | 61.4% | 58.4% |
| Interquartile 75% (IQ3) | 72.6% | 69.8% |
| Interquartile Range (IQR) | 11.2% | 11.5% |
| Standard Deviation (Sample) | 9.9% | 12.7% |
| Standard Deviation (Population) | 9.8% | 12.6% |
Demographics Similar to Sierra Leoneans and Immigrants from North Macedonia by College, Under 1 year
In terms of college, under 1 year, the demographic groups most similar to Sierra Leoneans are Celtic (65.9%, a difference of 0.030%), Tlingit-Haida (65.9%, a difference of 0.070%), Albanian (65.9%, a difference of 0.080%), Brazilian (65.9%, a difference of 0.090%), and Korean (65.9%, a difference of 0.13%). Similarly, the demographic groups most similar to Immigrants from North Macedonia are French (65.4%, a difference of 0.010%), Scotch-Irish (65.4%, a difference of 0.040%), Immigrants from Bosnia and Herzegovina (65.4%, a difference of 0.060%), Swiss (65.5%, a difference of 0.24%), and South American Indian (65.5%, a difference of 0.25%).
| Demographics | Rating | Rank | College, Under 1 year |
| Sierra Leoneans | 67.8 /100 | #157 | Good 66.0% |
| Celtics | 67.3 /100 | #158 | Good 65.9% |
| Tlingit-Haida | 66.4 /100 | #159 | Good 65.9% |
| Albanians | 66.1 /100 | #160 | Good 65.9% |
| Brazilians | 66.0 /100 | #161 | Good 65.9% |
| Koreans | 65.3 /100 | #162 | Good 65.9% |
| Somalis | 62.7 /100 | #163 | Good 65.8% |
| Czechoslovakians | 62.6 /100 | #164 | Good 65.8% |
| Immigrants | Uzbekistan | 61.6 /100 | #165 | Good 65.8% |
| Moroccans | 56.7 /100 | #166 | Average 65.6% |
| Immigrants | Somalia | 56.4 /100 | #167 | Average 65.6% |
| Hungarians | 55.9 /100 | #168 | Average 65.6% |
| Yugoslavians | 55.7 /100 | #169 | Average 65.6% |
| Germans | 55.7 /100 | #170 | Average 65.6% |
| Immigrants | Oceania | 55.0 /100 | #171 | Average 65.6% |
| South American Indians | 54.4 /100 | #172 | Average 65.5% |
| Swiss | 53.9 /100 | #173 | Average 65.5% |
| Immigrants | Bosnia and Herzegovina | 50.0 /100 | #174 | Average 65.4% |
| Scotch-Irish | 49.5 /100 | #175 | Average 65.4% |
| French | 48.9 /100 | #176 | Average 65.4% |
| Immigrants | North Macedonia | 48.6 /100 | #177 | Average 65.4% |