Sierra Leonean vs Hopi 7th Grade

COMPARE

Sierra Leonean
Race
Ancestry
AfghanAfricanAlaska NativeAlaskan AthabascanAlbanianAleutAlsatianAmericanApacheArabArapahoArgentineanArmenianAssyrian/Chaldean/SyriacAustralianAustrianBahamianBangladeshiBarbadianBasqueBelgianBelizeanBermudanBhutaneseBlackfeetBolivianBrazilianBritishBritish West IndianBulgarianBurmeseCajunCambodianCanadianCape VerdeanCarpatho RusynCelticCentral AmericanCentral American IndianCherokeeCheyenneChickasawChileanChineseChippewaChoctawColombianColvilleComancheCosta RicanCreeCreekCroatianCrowCubanCypriotCzechCzechoslovakianDanishDelawareDominicanDutchDutch West IndianEastern EuropeanEcuadorianEgyptianEnglishEstonianEthiopianEuropeanFijianFilipinoFinnishFrenchFrench American IndianFrench CanadianGermanGerman RussianGhanaianGreekGuamanian/ChamorroGuatemalanGuyaneseHaitianHmongHonduranHoumaHungarianIcelanderIndian (Asian)IndonesianInupiatIranianIraqiIrishIroquoisIsraeliItalianJamaicanJapaneseJordanianKenyanKiowaKoreanLaotianLatvianLebaneseLiberianLithuanianLumbeeLuxembourgerMacedonianMalaysianMalteseMarshalleseMenomineeMexicanMexican American IndianMongolianMoroccanNative HawaiianNavajoNepaleseNew ZealanderNicaraguanNigerianNorthern EuropeanNorwegianOkinawanOsageOttawaPaiutePakistaniPalestinianPanamanianParaguayanPennsylvania GermanPeruvianPimaPolishPortuguesePotawatomiPuebloPuerto RicanPuget Sound SalishRomanianRussianSalvadoranSamoanScandinavianScotch-IrishScottishSeminoleSenegaleseSerbianShoshoneSierra LeoneanSiouxSlavicSlovakSloveneSomaliSouth AfricanSouth AmericanSouth American IndianSoviet UnionSpaniardSpanishSpanish AmericanSpanish American IndianSri LankanSubsaharan AfricanSudaneseSwedishSwissSyrianTaiwaneseThaiTlingit-HaidaTohono O'OdhamTonganTrinidadian and TobagonianTsimshianTurkishU.S. Virgin IslanderUgandanUkrainianUruguayanUteVenezuelanVietnameseWelshWest IndianYakamaYaquiYugoslavianYumanYup'ikZimbabwean
Immigration
NonimmigrantsImmigrantsAfghanistanAfricaAlbaniaArgentinaArmeniaAsiaAustraliaAustriaBahamasBangladeshBarbadosBelarusBelgiumBelizeBoliviaBosnia and HerzegovinaBrazilBulgariaBurma/MyanmarCabo VerdeCambodiaCameroonCanadaCaribbeanCentral AmericaChileChinaColombiaCongoCosta RicaCroatiaCubaCzechoslovakiaDenmarkDominicaDominican RepublicEastern AfricaEastern AsiaEastern EuropeEcuadorEgyptEl SalvadorEnglandEritreaEthiopiaEuropeFijiFranceGermanyGhanaGreeceGrenadaGuatemalaGuyanaHaitiHondurasHong KongHungaryIndiaIndonesiaIranIraqIrelandIsraelItalyJamaicaJapanJordanKazakhstanKenyaKoreaKuwaitLaosLatin AmericaLatviaLebanonLiberiaLithuaniaMalaysiaMexicoMicronesiaMiddle AfricaMoldovaMoroccoNepalNetherlandsNicaraguaNigeriaNorth AmericaNorth MacedoniaNorthern AfricaNorthern EuropeNorwayOceaniaPakistanPanamaPeruPhilippinesPolandPortugalRomaniaRussiaSaudi ArabiaScotlandSenegalSerbiaSierra LeoneSingaporeSomaliaSouth AfricaSouth AmericaSouth Central AsiaSouth Eastern AsiaSouthern EuropeSpainSri LankaSt. Vincent and the GrenadinesSudanSwedenSwitzerlandSyriaTaiwanThailandTrinidad and TobagoTurkeyUgandaUkraineUruguayUzbekistanVenezuelaVietnamWest IndiesWestern AfricaWestern AsiaWestern EuropeYemenZaireZimbabweAzores
Hopi
Race
Ancestry
AfghanAfricanAlaska NativeAlaskan AthabascanAlbanianAleutAlsatianAmericanApacheArabArapahoArgentineanArmenianAssyrian/Chaldean/SyriacAustralianAustrianBahamianBangladeshiBarbadianBasqueBelgianBelizeanBermudanBhutaneseBlackfeetBolivianBrazilianBritishBritish West IndianBulgarianBurmeseCajunCambodianCanadianCape VerdeanCarpatho RusynCelticCentral AmericanCentral American IndianCherokeeCheyenneChickasawChileanChineseChippewaChoctawColombianColvilleComancheCosta RicanCreeCreekCroatianCrowCubanCypriotCzechCzechoslovakianDanishDelawareDominicanDutchDutch West IndianEastern EuropeanEcuadorianEgyptianEnglishEstonianEthiopianEuropeanFijianFilipinoFinnishFrenchFrench American IndianFrench CanadianGermanGerman RussianGhanaianGreekGuamanian/ChamorroGuatemalanGuyaneseHaitianHmongHonduranHopiHoumaHungarianIcelanderIndian (Asian)IndonesianInupiatIranianIraqiIrishIroquoisIsraeliItalianJamaicanJapaneseJordanianKenyanKiowaKoreanLaotianLatvianLebaneseLiberianLithuanianLumbeeLuxembourgerMacedonianMalaysianMalteseMarshalleseMenomineeMexicanMexican American IndianMongolianMoroccanNative HawaiianNavajoNepaleseNew ZealanderNicaraguanNigerianNorthern EuropeanNorwegianOkinawanOsageOttawaPaiutePakistaniPalestinianPanamanianParaguayanPennsylvania GermanPeruvianPimaPolishPortuguesePotawatomiPuebloPuerto RicanPuget Sound SalishRomanianRussianSalvadoranSamoanScandinavianScotch-IrishScottishSeminoleSenegaleseSerbianShoshoneSiouxSlavicSlovakSloveneSomaliSouth AfricanSouth AmericanSouth American IndianSoviet UnionSpaniardSpanishSpanish AmericanSpanish American IndianSri LankanSubsaharan AfricanSudaneseSwedishSwissSyrianTaiwaneseThaiTlingit-HaidaTohono O'OdhamTonganTrinidadian and TobagonianTsimshianTurkishU.S. Virgin IslanderUgandanUkrainianUruguayanUteVenezuelanVietnameseWelshWest IndianYakamaYaquiYugoslavianYumanYup'ikZimbabwean
Immigration
NonimmigrantsImmigrantsAfghanistanAfricaAlbaniaArgentinaArmeniaAsiaAustraliaAustriaBahamasBangladeshBarbadosBelarusBelgiumBelizeBoliviaBosnia and HerzegovinaBrazilBulgariaBurma/MyanmarCabo VerdeCambodiaCameroonCanadaCaribbeanCentral AmericaChileChinaColombiaCongoCosta RicaCroatiaCubaCzechoslovakiaDenmarkDominicaDominican RepublicEastern AfricaEastern AsiaEastern EuropeEcuadorEgyptEl SalvadorEnglandEritreaEthiopiaEuropeFijiFranceGermanyGhanaGreeceGrenadaGuatemalaGuyanaHaitiHondurasHong KongHungaryIndiaIndonesiaIranIraqIrelandIsraelItalyJamaicaJapanJordanKazakhstanKenyaKoreaKuwaitLaosLatin AmericaLatviaLebanonLiberiaLithuaniaMalaysiaMexicoMicronesiaMiddle AfricaMoldovaMoroccoNepalNetherlandsNicaraguaNigeriaNorth AmericaNorth MacedoniaNorthern AfricaNorthern EuropeNorwayOceaniaPakistanPanamaPeruPhilippinesPolandPortugalRomaniaRussiaSaudi ArabiaScotlandSenegalSerbiaSierra LeoneSingaporeSomaliaSouth AfricaSouth AmericaSouth Central AsiaSouth Eastern AsiaSouthern EuropeSpainSri LankaSt. Vincent and the GrenadinesSudanSwedenSwitzerlandSyriaTaiwanThailandTrinidad and TobagoTurkeyUgandaUkraineUruguayUzbekistanVenezuelaVietnamWest IndiesWestern AfricaWestern AsiaWestern EuropeYemenZaireZimbabweAzores
7th Grade
Income
Poverty
Unemployment
Labor Participation
Family Structure
Vehicle Availability
Education Level
Disability

7th Grade Comparison

Sierra Leoneans

Hopi

Fair
Excellent
96.0%
7TH GRADE
37.5/ 100
METRIC RATING
184th/ 347
METRIC RANK
96.3%
7TH GRADE
81.6/ 100
METRIC RATING
151st/ 347
METRIC RANK

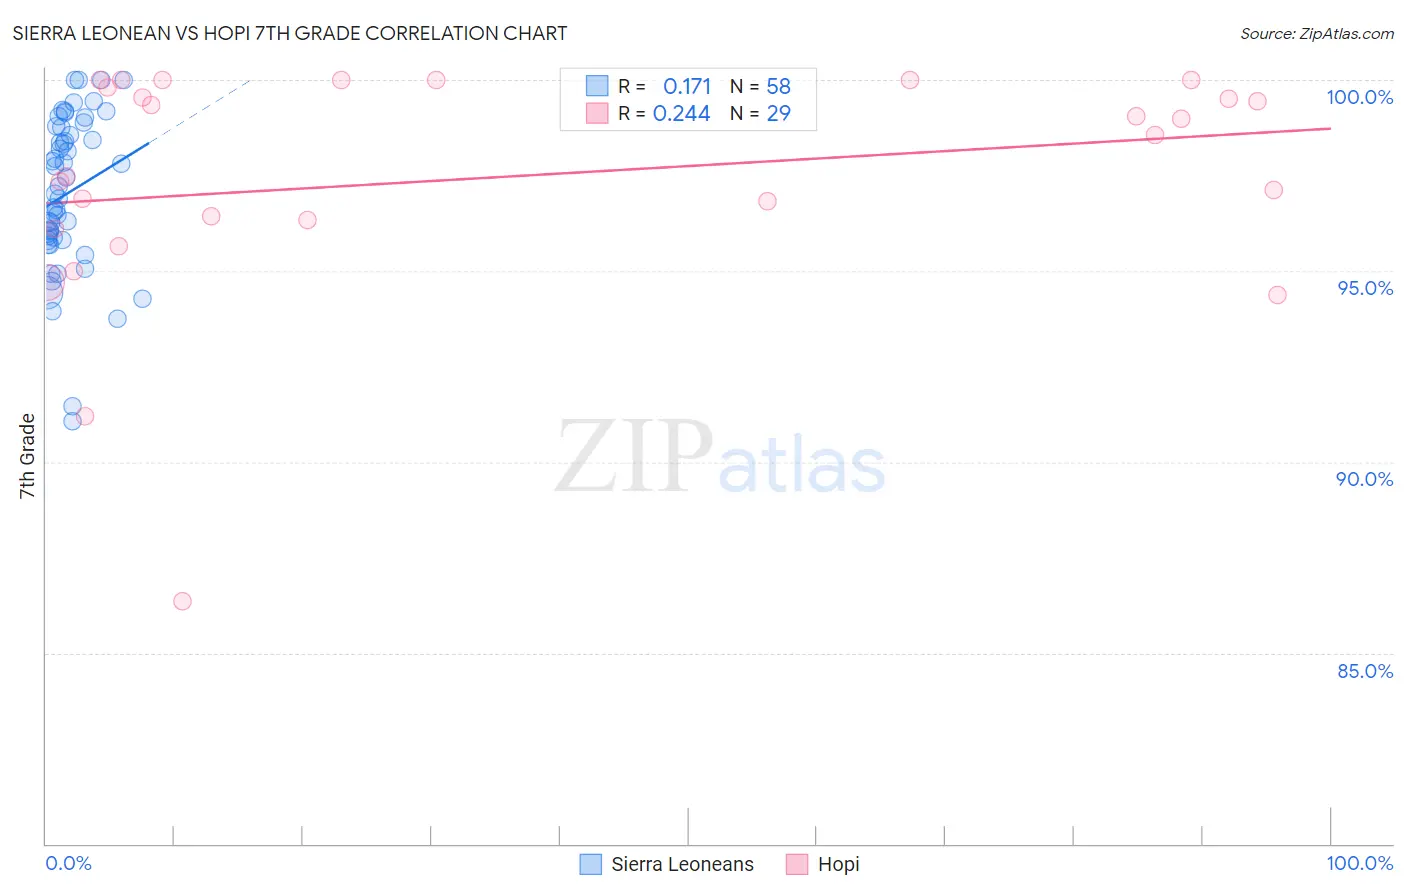
Sierra Leonean vs Hopi 7th Grade Correlation Chart

The statistical analysis conducted on geographies consisting of 83,337,655 people shows a poor positive correlation between the proportion of Sierra Leoneans and percentage of population with at least 7th grade education in the United States with a correlation coefficient (R) of 0.171 and weighted average of 96.0%. Similarly, the statistical analysis conducted on geographies consisting of 74,739,957 people shows a weak positive correlation between the proportion of Hopi and percentage of population with at least 7th grade education in the United States with a correlation coefficient (R) of 0.244 and weighted average of 96.3%, a difference of 0.31%.
Sierra Leonean vs Hopi 7th Grade

7th Grade Correlation Summary

MeasurementSierra LeoneanHopi
Minimum91.1%86.4%
Maximum100.0%100.0%
Range8.9%13.6%
Mean97.0%97.4%
Median97.1%98.6%
Interquartile 25% (IQ1)95.8%96.2%
Interquartile 75% (IQ3)98.8%99.9%
Interquartile Range (IQR)2.9%3.7%
Standard Deviation (Sample)2.0%3.1%
Standard Deviation (Population)2.0%3.0%

Similar Demographics by 7th Grade

Demographics Similar to Sierra Leoneans by 7th Grade

In terms of 7th grade, the demographic groups most similar to Sierra Leoneans are Brazilian (96.0%, a difference of 0.0%), Immigrants from Spain (96.0%, a difference of 0.010%), Immigrants from Iraq (96.0%, a difference of 0.010%), Immigrants from Uganda (96.0%, a difference of 0.010%), and Iraqi (96.0%, a difference of 0.020%).
DemographicsRating | Rank7th Grade
Immigrants | Korea
49.2
/100
|
#177
Average
96.0%
Marshallese
48.4
/100
|
#178
Average
96.0%
Immigrants | Iran
47.8
/100
|
#179
Average
96.0%
Immigrants | Brazil
46.8
/100
|
#180
Average
96.0%
Pakistanis
44.5
/100
|
#181
Average
96.0%
Iraqis
41.2
/100
|
#182
Average
96.0%
Immigrants | Spain
38.8
/100
|
#183
Fair
96.0%
Sierra Leoneans
37.5
/100
|
#184
Fair
96.0%
Brazilians
37.3
/100
|
#185
Fair
96.0%
Immigrants | Iraq
36.1
/100
|
#186
Fair
96.0%
Immigrants | Uganda
36.0
/100
|
#187
Fair
96.0%
Immigrants | Egypt
34.3
/100
|
#188
Fair
95.9%
Immigrants | Venezuela
33.9
/100
|
#189
Fair
95.9%
Immigrants | Micronesia
32.6
/100
|
#190
Fair
95.9%
Liberians
32.5
/100
|
#191
Fair
95.9%

Demographics Similar to Hopi by 7th Grade

In terms of 7th grade, the demographic groups most similar to Hopi are Israeli (96.3%, a difference of 0.010%), Albanian (96.3%, a difference of 0.010%), Immigrants from Belarus (96.3%, a difference of 0.010%), Immigrants from Eastern Europe (96.3%, a difference of 0.020%), and French American Indian (96.3%, a difference of 0.020%).
DemographicsRating | Rank7th Grade
Immigrants | Greece
85.9
/100
|
#144
Excellent
96.3%
Blackfeet
83.9
/100
|
#145
Excellent
96.3%
Immigrants | Eastern Europe
83.7
/100
|
#146
Excellent
96.3%
French American Indians
83.1
/100
|
#147
Excellent
96.3%
Israelis
82.8
/100
|
#148
Excellent
96.3%
Albanians
82.6
/100
|
#149
Excellent
96.3%
Immigrants | Belarus
82.4
/100
|
#150
Excellent
96.3%
Hopi
81.6
/100
|
#151
Excellent
96.3%
Immigrants | Russia
78.4
/100
|
#152
Good
96.2%
Seminole
78.1
/100
|
#153
Good
96.2%
Immigrants | Israel
77.6
/100
|
#154
Good
96.2%
Immigrants | Jordan
77.0
/100
|
#155
Good
96.2%
Kenyans
76.2
/100
|
#156
Good
96.2%
Ugandans
75.5
/100
|
#157
Good
96.2%
Arabs
68.6
/100
|
#158
Good
96.2%