Immigrants from Ireland vs Hopi 7th Grade
COMPARE
Immigrants from Ireland
Hopi
7th Grade
7th Grade Comparison
Immigrants from Ireland
Hopi
96.8%
7TH GRADE
99.4/ 100
METRIC RATING
76th/ 347
METRIC RANK
96.3%
7TH GRADE
81.6/ 100
METRIC RATING
151st/ 347
METRIC RANK
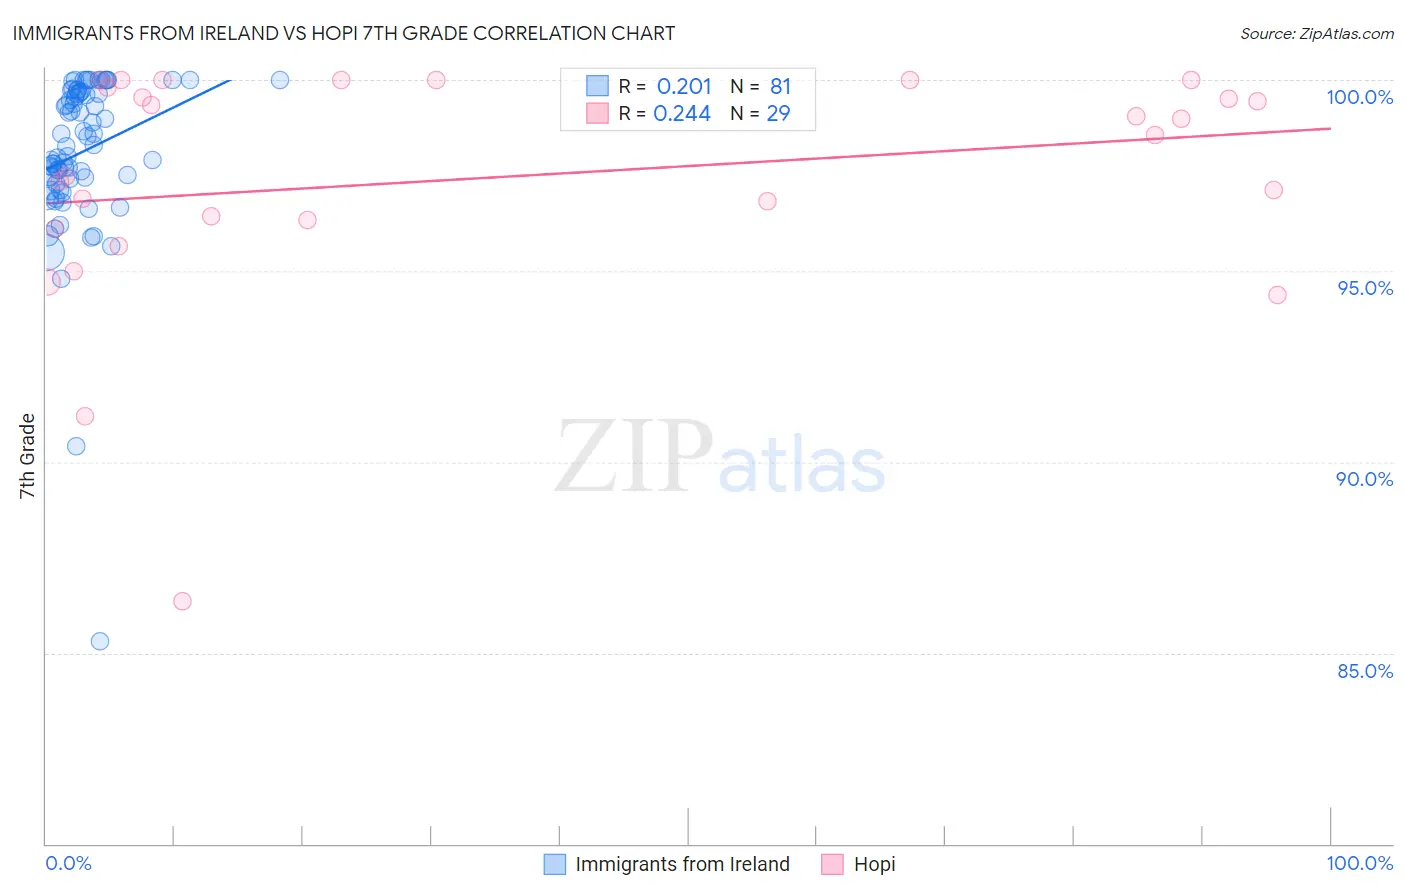
Immigrants from Ireland vs Hopi 7th Grade Correlation Chart
The statistical analysis conducted on geographies consisting of 240,784,498 people shows a weak positive correlation between the proportion of Immigrants from Ireland and percentage of population with at least 7th grade education in the United States with a correlation coefficient (R) of 0.201 and weighted average of 96.8%. Similarly, the statistical analysis conducted on geographies consisting of 74,739,957 people shows a weak positive correlation between the proportion of Hopi and percentage of population with at least 7th grade education in the United States with a correlation coefficient (R) of 0.244 and weighted average of 96.3%, a difference of 0.54%.
7th Grade Correlation Summary
| Measurement | Immigrants from Ireland | Hopi |
| Minimum | 85.3% | 86.4% |
| Maximum | 100.0% | 100.0% |
| Range | 14.7% | 13.6% |
| Mean | 98.1% | 97.4% |
| Median | 98.3% | 98.6% |
| Interquartile 25% (IQ1) | 97.4% | 96.2% |
| Interquartile 75% (IQ3) | 99.7% | 99.9% |
| Interquartile Range (IQR) | 2.3% | 3.7% |
| Standard Deviation (Sample) | 2.2% | 3.1% |
| Standard Deviation (Population) | 2.2% | 3.0% |
Similar Demographics by 7th Grade
Demographics Similar to Immigrants from Ireland by 7th Grade
In terms of 7th grade, the demographic groups most similar to Immigrants from Ireland are Cherokee (96.8%, a difference of 0.0%), Immigrants from Netherlands (96.8%, a difference of 0.010%), Cypriot (96.8%, a difference of 0.010%), Yugoslavian (96.8%, a difference of 0.010%), and Zimbabwean (96.8%, a difference of 0.020%).
| Demographics | Rating | Rank | 7th Grade |
| Iranians | 99.6 /100 | #69 | Exceptional 96.8% |
| New Zealanders | 99.6 /100 | #70 | Exceptional 96.8% |
| Immigrants | Lithuania | 99.6 /100 | #71 | Exceptional 96.8% |
| Cajuns | 99.5 /100 | #72 | Exceptional 96.8% |
| Arapaho | 99.5 /100 | #73 | Exceptional 96.8% |
| Immigrants | England | 99.5 /100 | #74 | Exceptional 96.8% |
| Zimbabweans | 99.5 /100 | #75 | Exceptional 96.8% |
| Immigrants | Ireland | 99.4 /100 | #76 | Exceptional 96.8% |
| Cherokee | 99.4 /100 | #77 | Exceptional 96.8% |
| Immigrants | Netherlands | 99.3 /100 | #78 | Exceptional 96.8% |
| Cypriots | 99.3 /100 | #79 | Exceptional 96.8% |
| Yugoslavians | 99.3 /100 | #80 | Exceptional 96.8% |
| Delaware | 99.2 /100 | #81 | Exceptional 96.8% |
| Chickasaw | 99.2 /100 | #82 | Exceptional 96.7% |
| Icelanders | 99.1 /100 | #83 | Exceptional 96.7% |
Demographics Similar to Hopi by 7th Grade
In terms of 7th grade, the demographic groups most similar to Hopi are Israeli (96.3%, a difference of 0.010%), Albanian (96.3%, a difference of 0.010%), Immigrants from Belarus (96.3%, a difference of 0.010%), Immigrants from Eastern Europe (96.3%, a difference of 0.020%), and French American Indian (96.3%, a difference of 0.020%).
| Demographics | Rating | Rank | 7th Grade |
| Immigrants | Greece | 85.9 /100 | #144 | Excellent 96.3% |
| Blackfeet | 83.9 /100 | #145 | Excellent 96.3% |
| Immigrants | Eastern Europe | 83.7 /100 | #146 | Excellent 96.3% |
| French American Indians | 83.1 /100 | #147 | Excellent 96.3% |
| Israelis | 82.8 /100 | #148 | Excellent 96.3% |
| Albanians | 82.6 /100 | #149 | Excellent 96.3% |
| Immigrants | Belarus | 82.4 /100 | #150 | Excellent 96.3% |
| Hopi | 81.6 /100 | #151 | Excellent 96.3% |
| Immigrants | Russia | 78.4 /100 | #152 | Good 96.2% |
| Seminole | 78.1 /100 | #153 | Good 96.2% |
| Immigrants | Israel | 77.6 /100 | #154 | Good 96.2% |
| Immigrants | Jordan | 77.0 /100 | #155 | Good 96.2% |
| Kenyans | 76.2 /100 | #156 | Good 96.2% |
| Ugandans | 75.5 /100 | #157 | Good 96.2% |
| Arabs | 68.6 /100 | #158 | Good 96.2% |