Senegalese vs Immigrants from Cameroon 5th Grade
COMPARE
Senegalese
Immigrants from Cameroon
5th Grade
5th Grade Comparison
Senegalese
Immigrants from Cameroon
97.0%
5TH GRADE
2.8/ 100
METRIC RATING
236th/ 347
METRIC RANK
96.7%
5TH GRADE
0.1/ 100
METRIC RATING
274th/ 347
METRIC RANK
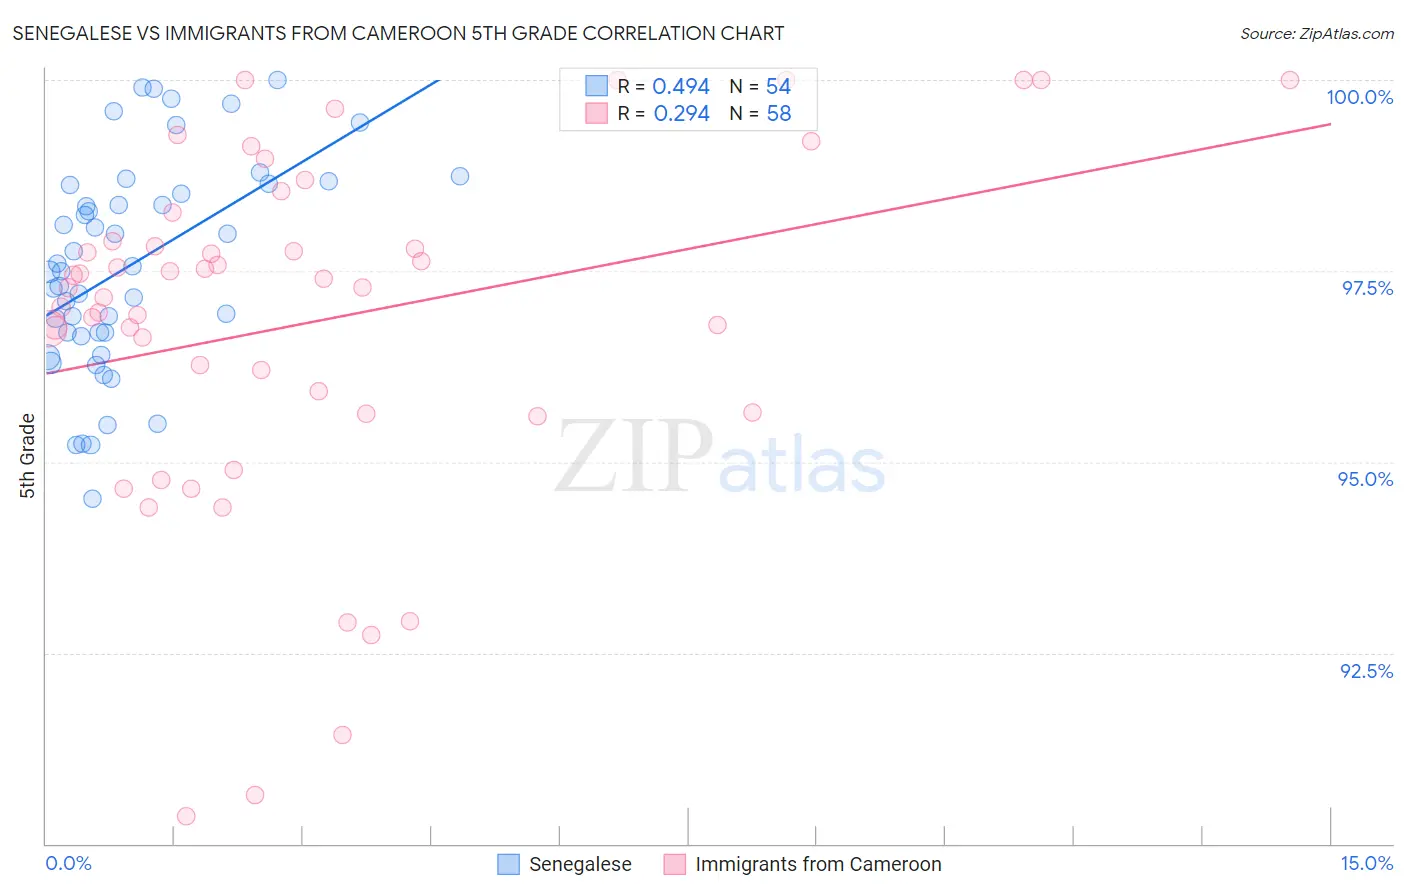
Senegalese vs Immigrants from Cameroon 5th Grade Correlation Chart
The statistical analysis conducted on geographies consisting of 78,142,569 people shows a moderate positive correlation between the proportion of Senegalese and percentage of population with at least 5th grade education in the United States with a correlation coefficient (R) of 0.494 and weighted average of 97.0%. Similarly, the statistical analysis conducted on geographies consisting of 130,752,798 people shows a weak positive correlation between the proportion of Immigrants from Cameroon and percentage of population with at least 5th grade education in the United States with a correlation coefficient (R) of 0.294 and weighted average of 96.7%, a difference of 0.32%.
5th Grade Correlation Summary
| Measurement | Senegalese | Immigrants from Cameroon |
| Minimum | 94.5% | 90.4% |
| Maximum | 100.0% | 100.0% |
| Range | 5.5% | 9.6% |
| Mean | 97.6% | 96.8% |
| Median | 97.5% | 97.3% |
| Interquartile 25% (IQ1) | 96.7% | 95.7% |
| Interquartile 75% (IQ3) | 98.6% | 97.9% |
| Interquartile Range (IQR) | 1.9% | 2.2% |
| Standard Deviation (Sample) | 1.4% | 2.3% |
| Standard Deviation (Population) | 1.4% | 2.3% |
Similar Demographics by 5th Grade
Demographics Similar to Senegalese by 5th Grade
In terms of 5th grade, the demographic groups most similar to Senegalese are Subsaharan African (97.0%, a difference of 0.020%), Tohono O'odham (97.0%, a difference of 0.020%), Uruguayan (97.0%, a difference of 0.020%), Immigrants from Indonesia (96.9%, a difference of 0.030%), and Asian (96.9%, a difference of 0.030%).
| Demographics | Rating | Rank | 5th Grade |
| Yuman | 4.5 /100 | #229 | Tragic 97.0% |
| Immigrants | Western Asia | 4.3 /100 | #230 | Tragic 97.0% |
| Immigrants | Malaysia | 4.1 /100 | #231 | Tragic 97.0% |
| Immigrants | Eastern Asia | 4.0 /100 | #232 | Tragic 97.0% |
| Sub-Saharan Africans | 3.3 /100 | #233 | Tragic 97.0% |
| Tohono O'odham | 3.2 /100 | #234 | Tragic 97.0% |
| Uruguayans | 3.2 /100 | #235 | Tragic 97.0% |
| Senegalese | 2.8 /100 | #236 | Tragic 97.0% |
| Immigrants | Indonesia | 2.0 /100 | #237 | Tragic 96.9% |
| Asians | 2.0 /100 | #238 | Tragic 96.9% |
| Nigerians | 1.9 /100 | #239 | Tragic 96.9% |
| Indians (Asian) | 1.9 /100 | #240 | Tragic 96.9% |
| Immigrants | Asia | 1.7 /100 | #241 | Tragic 96.9% |
| Immigrants | Costa Rica | 1.6 /100 | #242 | Tragic 96.9% |
| Immigrants | Eastern Africa | 1.6 /100 | #243 | Tragic 96.9% |
Demographics Similar to Immigrants from Cameroon by 5th Grade
In terms of 5th grade, the demographic groups most similar to Immigrants from Cameroon are Yaqui (96.7%, a difference of 0.0%), Trinidadian and Tobagonian (96.7%, a difference of 0.010%), Immigrants from Peru (96.6%, a difference of 0.010%), Cuban (96.6%, a difference of 0.010%), and Immigrants from Bolivia (96.6%, a difference of 0.010%).
| Demographics | Rating | Rank | 5th Grade |
| Immigrants | South America | 0.3 /100 | #267 | Tragic 96.7% |
| Armenians | 0.3 /100 | #268 | Tragic 96.7% |
| Ghanaians | 0.2 /100 | #269 | Tragic 96.7% |
| Afghans | 0.2 /100 | #270 | Tragic 96.7% |
| Immigrants | Hong Kong | 0.2 /100 | #271 | Tragic 96.7% |
| Trinidadians and Tobagonians | 0.1 /100 | #272 | Tragic 96.7% |
| Yaqui | 0.1 /100 | #273 | Tragic 96.7% |
| Immigrants | Cameroon | 0.1 /100 | #274 | Tragic 96.7% |
| Immigrants | Peru | 0.1 /100 | #275 | Tragic 96.6% |
| Cubans | 0.1 /100 | #276 | Tragic 96.6% |
| Immigrants | Bolivia | 0.1 /100 | #277 | Tragic 96.6% |
| Immigrants | Ghana | 0.1 /100 | #278 | Tragic 96.6% |
| Immigrants | Philippines | 0.1 /100 | #279 | Tragic 96.6% |
| Immigrants | Western Africa | 0.1 /100 | #280 | Tragic 96.6% |
| Houma | 0.1 /100 | #281 | Tragic 96.6% |