Immigrants from South America vs Immigrants from Cameroon 5th Grade
COMPARE
Immigrants from South America
Immigrants from Cameroon
5th Grade
5th Grade Comparison
Immigrants from South America
Immigrants from Cameroon
96.7%
5TH GRADE
0.3/ 100
METRIC RATING
267th/ 347
METRIC RANK
96.7%
5TH GRADE
0.1/ 100
METRIC RATING
274th/ 347
METRIC RANK
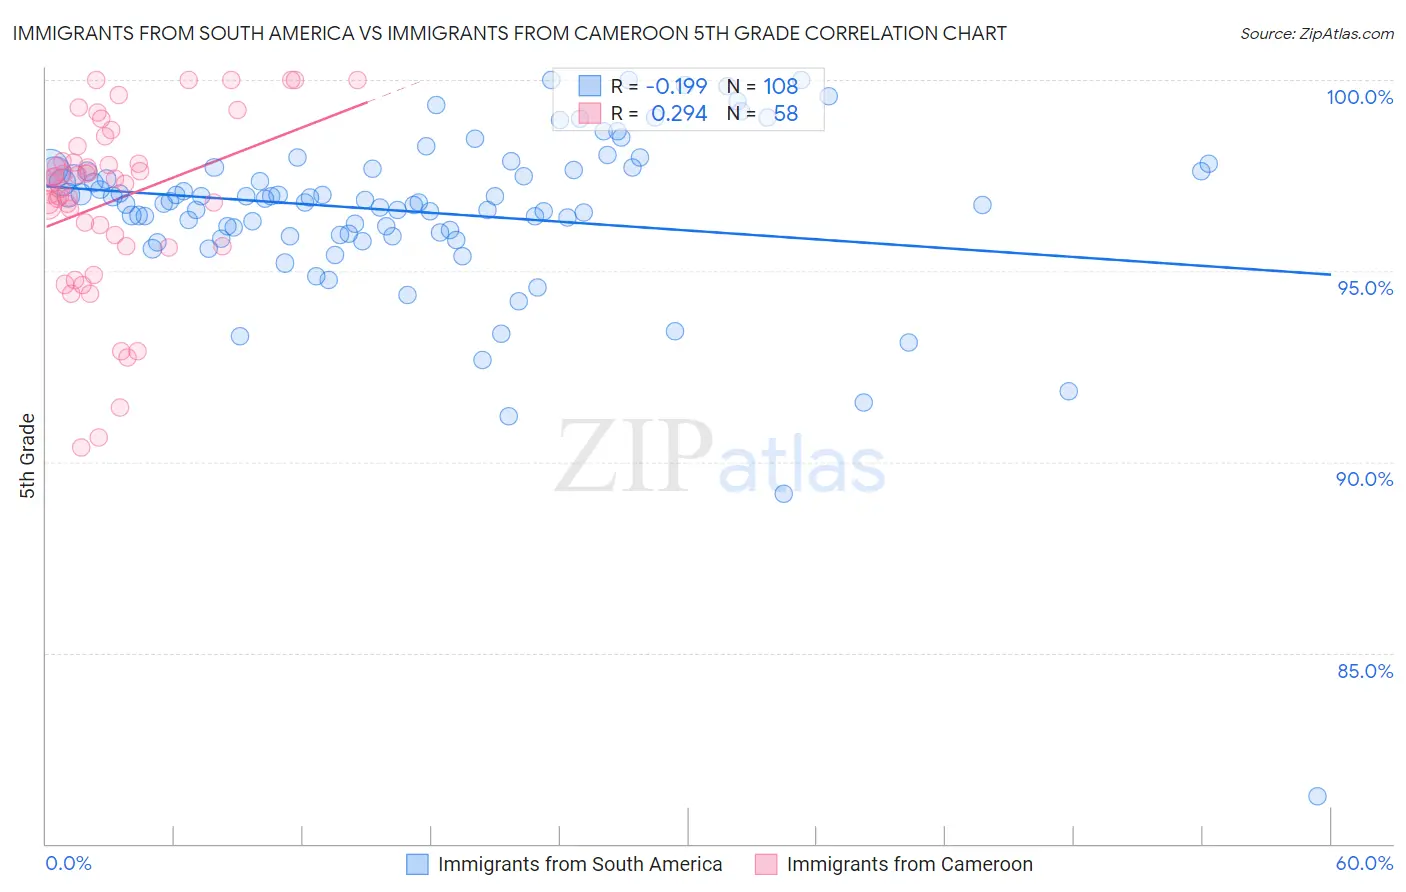
Immigrants from South America vs Immigrants from Cameroon 5th Grade Correlation Chart
The statistical analysis conducted on geographies consisting of 486,429,751 people shows a poor negative correlation between the proportion of Immigrants from South America and percentage of population with at least 5th grade education in the United States with a correlation coefficient (R) of -0.199 and weighted average of 96.7%. Similarly, the statistical analysis conducted on geographies consisting of 130,752,798 people shows a weak positive correlation between the proportion of Immigrants from Cameroon and percentage of population with at least 5th grade education in the United States with a correlation coefficient (R) of 0.294 and weighted average of 96.7%, a difference of 0.080%.
5th Grade Correlation Summary
| Measurement | Immigrants from South America | Immigrants from Cameroon |
| Minimum | 81.2% | 90.4% |
| Maximum | 100.0% | 100.0% |
| Range | 18.8% | 9.6% |
| Mean | 96.5% | 96.8% |
| Median | 96.8% | 97.3% |
| Interquartile 25% (IQ1) | 96.0% | 95.7% |
| Interquartile 75% (IQ3) | 97.7% | 97.9% |
| Interquartile Range (IQR) | 1.7% | 2.2% |
| Standard Deviation (Sample) | 2.4% | 2.3% |
| Standard Deviation (Population) | 2.4% | 2.3% |
Demographics Similar to Immigrants from South America and Immigrants from Cameroon by 5th Grade
In terms of 5th grade, the demographic groups most similar to Immigrants from South America are West Indian (96.8%, a difference of 0.010%), Taiwanese (96.7%, a difference of 0.010%), Immigrants from Nigeria (96.7%, a difference of 0.010%), Armenian (96.7%, a difference of 0.010%), and Immigrants from Uzbekistan (96.8%, a difference of 0.020%). Similarly, the demographic groups most similar to Immigrants from Cameroon are Yaqui (96.7%, a difference of 0.0%), Trinidadian and Tobagonian (96.7%, a difference of 0.010%), Immigrants from Peru (96.6%, a difference of 0.010%), Cuban (96.6%, a difference of 0.010%), and Immigrants from Bolivia (96.6%, a difference of 0.010%).
| Demographics | Rating | Rank | 5th Grade |
| Immigrants | Jamaica | 0.4 /100 | #260 | Tragic 96.8% |
| Immigrants | Sierra Leone | 0.4 /100 | #261 | Tragic 96.8% |
| Immigrants | Colombia | 0.4 /100 | #262 | Tragic 96.8% |
| Immigrants | Uzbekistan | 0.3 /100 | #263 | Tragic 96.8% |
| West Indians | 0.3 /100 | #264 | Tragic 96.8% |
| Taiwanese | 0.3 /100 | #265 | Tragic 96.7% |
| Immigrants | Nigeria | 0.3 /100 | #266 | Tragic 96.7% |
| Immigrants | South America | 0.3 /100 | #267 | Tragic 96.7% |
| Armenians | 0.3 /100 | #268 | Tragic 96.7% |
| Ghanaians | 0.2 /100 | #269 | Tragic 96.7% |
| Afghans | 0.2 /100 | #270 | Tragic 96.7% |
| Immigrants | Hong Kong | 0.2 /100 | #271 | Tragic 96.7% |
| Trinidadians and Tobagonians | 0.1 /100 | #272 | Tragic 96.7% |
| Yaqui | 0.1 /100 | #273 | Tragic 96.7% |
| Immigrants | Cameroon | 0.1 /100 | #274 | Tragic 96.7% |
| Immigrants | Peru | 0.1 /100 | #275 | Tragic 96.6% |
| Cubans | 0.1 /100 | #276 | Tragic 96.6% |
| Immigrants | Bolivia | 0.1 /100 | #277 | Tragic 96.6% |
| Immigrants | Ghana | 0.1 /100 | #278 | Tragic 96.6% |
| Immigrants | Philippines | 0.1 /100 | #279 | Tragic 96.6% |
| Immigrants | Western Africa | 0.1 /100 | #280 | Tragic 96.6% |