Scotch-Irish vs Immigrants from Sierra Leone High School Diploma

COMPARE

Scotch-Irish
Race
Ancestry
AfghanAfricanAlaska NativeAlaskan AthabascanAlbanianAleutAlsatianAmericanApacheArabArapahoArgentineanArmenianAssyrian/Chaldean/SyriacAustralianAustrianBahamianBangladeshiBarbadianBasqueBelgianBelizeanBermudanBhutaneseBlackfeetBolivianBrazilianBritishBritish West IndianBulgarianBurmeseCajunCambodianCanadianCape VerdeanCarpatho RusynCelticCentral AmericanCentral American IndianCherokeeCheyenneChickasawChileanChineseChippewaChoctawColombianColvilleComancheCosta RicanCreeCreekCroatianCrowCubanCypriotCzechCzechoslovakianDanishDelawareDominicanDutchDutch West IndianEastern EuropeanEcuadorianEgyptianEnglishEstonianEthiopianEuropeanFijianFilipinoFinnishFrenchFrench American IndianFrench CanadianGermanGerman RussianGhanaianGreekGuamanian/ChamorroGuatemalanGuyaneseHaitianHmongHonduranHopiHoumaHungarianIcelanderIndian (Asian)IndonesianInupiatIranianIraqiIrishIroquoisIsraeliItalianJamaicanJapaneseJordanianKenyanKiowaKoreanLaotianLatvianLebaneseLiberianLithuanianLumbeeLuxembourgerMacedonianMalaysianMalteseMarshalleseMenomineeMexicanMexican American IndianMongolianMoroccanNative HawaiianNavajoNepaleseNew ZealanderNicaraguanNigerianNorthern EuropeanNorwegianOkinawanOsageOttawaPaiutePakistaniPalestinianPanamanianParaguayanPennsylvania GermanPeruvianPimaPolishPortuguesePotawatomiPuebloPuerto RicanPuget Sound SalishRomanianRussianSalvadoranSamoanScandinavianScotch-IrishScottishSeminoleSenegaleseSerbianShoshoneSierra LeoneanSiouxSlavicSlovakSloveneSomaliSouth AfricanSouth AmericanSouth American IndianSoviet UnionSpaniardSpanishSpanish AmericanSpanish American IndianSri LankanSubsaharan AfricanSudaneseSwedishSwissSyrianTaiwaneseThaiTlingit-HaidaTohono O'OdhamTonganTrinidadian and TobagonianTsimshianTurkishU.S. Virgin IslanderUgandanUkrainianUruguayanUteVenezuelanVietnameseWelshWest IndianYakamaYaquiYugoslavianYumanYup'ikZimbabwean
Immigration
NonimmigrantsImmigrantsAfghanistanAfricaAlbaniaArgentinaArmeniaAsiaAustraliaAustriaBahamasBangladeshBarbadosBelarusBelgiumBelizeBoliviaBosnia and HerzegovinaBrazilBulgariaBurma/MyanmarCabo VerdeCambodiaCameroonCanadaCaribbeanCentral AmericaChileChinaColombiaCongoCosta RicaCroatiaCubaCzechoslovakiaDenmarkDominicaDominican RepublicEastern AfricaEastern AsiaEastern EuropeEcuadorEgyptEl SalvadorEnglandEritreaEthiopiaEuropeFijiFranceGermanyGhanaGreeceGrenadaGuatemalaGuyanaHaitiHondurasHong KongHungaryIndiaIndonesiaIranIraqIrelandIsraelItalyJamaicaJapanJordanKazakhstanKenyaKoreaKuwaitLaosLatin AmericaLatviaLebanonLiberiaLithuaniaMalaysiaMexicoMicronesiaMiddle AfricaMoldovaMoroccoNepalNetherlandsNicaraguaNigeriaNorth AmericaNorth MacedoniaNorthern AfricaNorthern EuropeNorwayOceaniaPakistanPanamaPeruPhilippinesPolandPortugalRomaniaRussiaSaudi ArabiaScotlandSenegalSerbiaSingaporeSomaliaSouth AfricaSouth AmericaSouth Central AsiaSouth Eastern AsiaSouthern EuropeSpainSri LankaSt. Vincent and the GrenadinesSudanSwedenSwitzerlandSyriaTaiwanThailandTrinidad and TobagoTurkeyUgandaUkraineUruguayUzbekistanVenezuelaVietnamWest IndiesWestern AfricaWestern AsiaWestern EuropeYemenZaireZimbabweAzores
Immigrants from Sierra Leone
Race
Ancestry
AfghanAfricanAlaska NativeAlaskan AthabascanAlbanianAleutAlsatianAmericanApacheArabArapahoArgentineanArmenianAssyrian/Chaldean/SyriacAustralianAustrianBahamianBangladeshiBarbadianBasqueBelgianBelizeanBermudanBhutaneseBlackfeetBolivianBrazilianBritishBritish West IndianBulgarianBurmeseCajunCambodianCanadianCape VerdeanCarpatho RusynCelticCentral AmericanCentral American IndianCherokeeCheyenneChickasawChileanChineseChippewaChoctawColombianColvilleComancheCosta RicanCreeCreekCroatianCrowCubanCypriotCzechCzechoslovakianDanishDelawareDominicanDutchDutch West IndianEastern EuropeanEcuadorianEgyptianEnglishEstonianEthiopianEuropeanFijianFilipinoFinnishFrenchFrench American IndianFrench CanadianGermanGerman RussianGhanaianGreekGuamanian/ChamorroGuatemalanGuyaneseHaitianHmongHonduranHopiHoumaHungarianIcelanderIndian (Asian)IndonesianInupiatIranianIraqiIrishIroquoisIsraeliItalianJamaicanJapaneseJordanianKenyanKiowaKoreanLaotianLatvianLebaneseLiberianLithuanianLumbeeLuxembourgerMacedonianMalaysianMalteseMarshalleseMenomineeMexicanMexican American IndianMongolianMoroccanNative HawaiianNavajoNepaleseNew ZealanderNicaraguanNigerianNorthern EuropeanNorwegianOkinawanOsageOttawaPaiutePakistaniPalestinianPanamanianParaguayanPennsylvania GermanPeruvianPimaPolishPortuguesePotawatomiPuebloPuerto RicanPuget Sound SalishRomanianRussianSalvadoranSamoanScandinavianScottishSeminoleSenegaleseSerbianShoshoneSierra LeoneanSiouxSlavicSlovakSloveneSomaliSouth AfricanSouth AmericanSouth American IndianSoviet UnionSpaniardSpanishSpanish AmericanSpanish American IndianSri LankanSubsaharan AfricanSudaneseSwedishSwissSyrianTaiwaneseThaiTlingit-HaidaTohono O'OdhamTonganTrinidadian and TobagonianTsimshianTurkishU.S. Virgin IslanderUgandanUkrainianUruguayanUteVenezuelanVietnameseWelshWest IndianYakamaYaquiYugoslavianYumanYup'ikZimbabwean
Immigration
NonimmigrantsImmigrantsAfghanistanAfricaAlbaniaArgentinaArmeniaAsiaAustraliaAustriaBahamasBangladeshBarbadosBelarusBelgiumBelizeBoliviaBosnia and HerzegovinaBrazilBulgariaBurma/MyanmarCabo VerdeCambodiaCameroonCanadaCaribbeanCentral AmericaChileChinaColombiaCongoCosta RicaCroatiaCubaCzechoslovakiaDenmarkDominicaDominican RepublicEastern AfricaEastern AsiaEastern EuropeEcuadorEgyptEl SalvadorEnglandEritreaEthiopiaEuropeFijiFranceGermanyGhanaGreeceGrenadaGuatemalaGuyanaHaitiHondurasHong KongHungaryIndiaIndonesiaIranIraqIrelandIsraelItalyJamaicaJapanJordanKazakhstanKenyaKoreaKuwaitLaosLatin AmericaLatviaLebanonLiberiaLithuaniaMalaysiaMexicoMicronesiaMiddle AfricaMoldovaMoroccoNepalNetherlandsNicaraguaNigeriaNorth AmericaNorth MacedoniaNorthern AfricaNorthern EuropeNorwayOceaniaPakistanPanamaPeruPhilippinesPolandPortugalRomaniaRussiaSaudi ArabiaScotlandSenegalSerbiaSierra LeoneSingaporeSomaliaSouth AfricaSouth AmericaSouth Central AsiaSouth Eastern AsiaSouthern EuropeSpainSri LankaSt. Vincent and the GrenadinesSudanSwedenSwitzerlandSyriaTaiwanThailandTrinidad and TobagoTurkeyUgandaUkraineUruguayUzbekistanVenezuelaVietnamWest IndiesWestern AfricaWestern AsiaWestern EuropeYemenZaireZimbabweAzores
High School Diploma
Income
Poverty
Unemployment
Labor Participation
Family Structure
Vehicle Availability
Education Level
Disability

High School Diploma Comparison

Scotch-Irish

Immigrants from Sierra Leone

Exceptional
Poor
90.8%
HIGH SCHOOL DIPLOMA
99.2/ 100
METRIC RATING
82nd/ 347
METRIC RANK
88.6%
HIGH SCHOOL DIPLOMA
15.8/ 100
METRIC RATING
207th/ 347
METRIC RANK

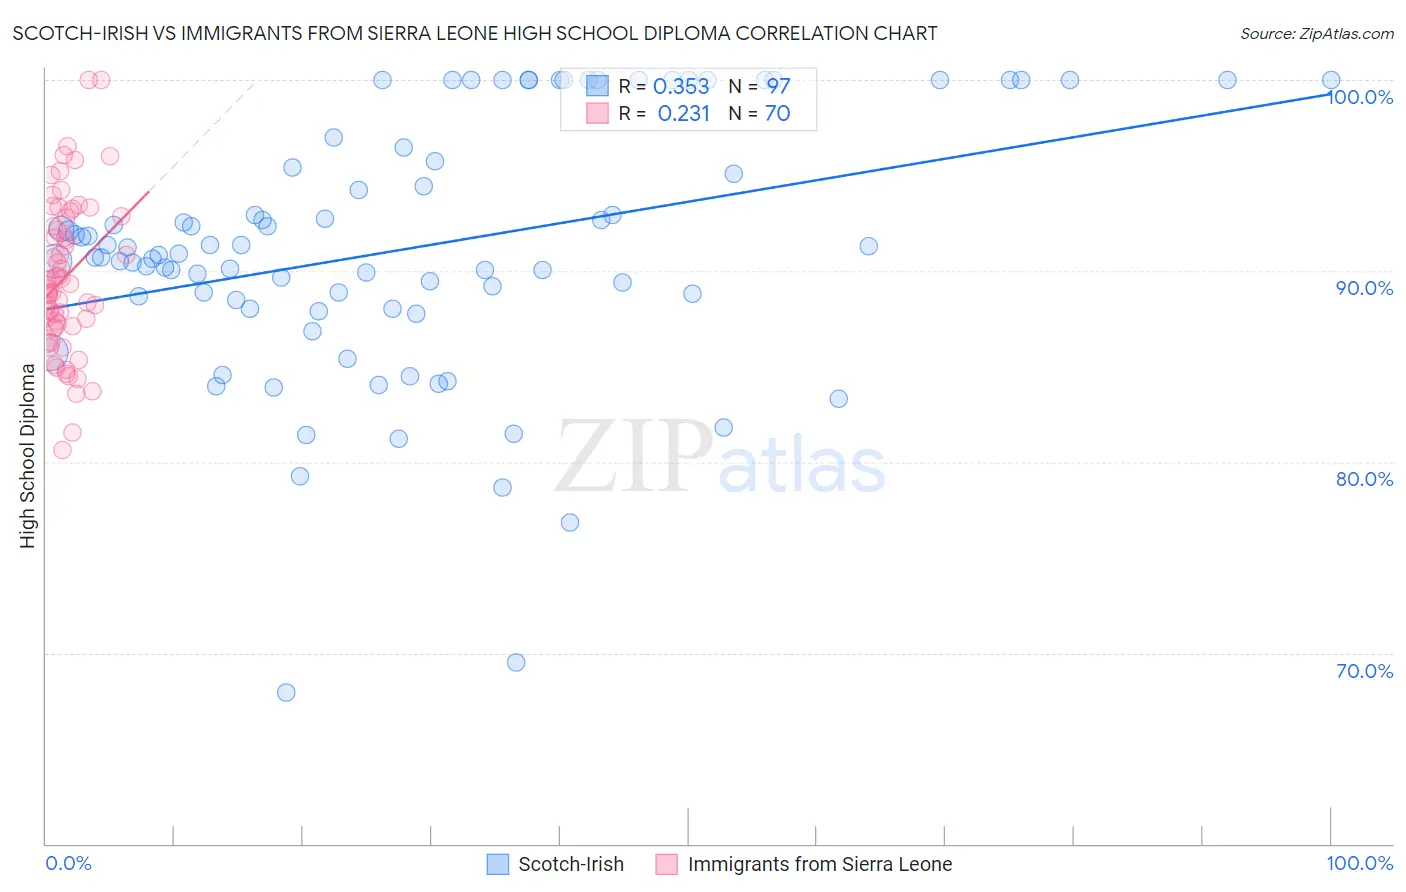
Scotch-Irish vs Immigrants from Sierra Leone High School Diploma Correlation Chart

The statistical analysis conducted on geographies consisting of 548,780,422 people shows a mild positive correlation between the proportion of Scotch-Irish and percentage of population with at least high school diploma education in the United States with a correlation coefficient (R) of 0.353 and weighted average of 90.8%. Similarly, the statistical analysis conducted on geographies consisting of 101,634,956 people shows a weak positive correlation between the proportion of Immigrants from Sierra Leone and percentage of population with at least high school diploma education in the United States with a correlation coefficient (R) of 0.231 and weighted average of 88.6%, a difference of 2.5%.
Scotch-Irish vs Immigrants from Sierra Leone High School Diploma

High School Diploma Correlation Summary

MeasurementScotch-IrishImmigrants from Sierra Leone
Minimum67.9%80.6%
Maximum100.0%100.0%
Range32.1%19.4%
Mean91.2%89.7%
Median90.9%89.2%
Interquartile 25% (IQ1)88.2%87.1%
Interquartile 75% (IQ3)96.1%92.8%
Interquartile Range (IQR)7.9%5.6%
Standard Deviation (Sample)6.7%4.0%
Standard Deviation (Population)6.7%4.0%

Similar Demographics by High School Diploma

Demographics Similar to Scotch-Irish by High School Diploma

In terms of high school diploma, the demographic groups most similar to Scotch-Irish are Immigrants from Moldova (90.7%, a difference of 0.020%), Immigrants from England (90.8%, a difference of 0.040%), Immigrants from Switzerland (90.8%, a difference of 0.040%), Immigrants from Denmark (90.8%, a difference of 0.050%), and Immigrants from Saudi Arabia (90.7%, a difference of 0.050%).
DemographicsRating | RankHigh School Diploma
Cambodians
99.4
/100
|
#75
Exceptional
90.8%
Hungarians
99.3
/100
|
#76
Exceptional
90.8%
Native Hawaiians
99.3
/100
|
#77
Exceptional
90.8%
Burmese
99.3
/100
|
#78
Exceptional
90.8%
Immigrants | Denmark
99.3
/100
|
#79
Exceptional
90.8%
Immigrants | England
99.3
/100
|
#80
Exceptional
90.8%
Immigrants | Switzerland
99.3
/100
|
#81
Exceptional
90.8%
Scotch-Irish
99.2
/100
|
#82
Exceptional
90.8%
Immigrants | Moldova
99.2
/100
|
#83
Exceptional
90.7%
Immigrants | Saudi Arabia
99.1
/100
|
#84
Exceptional
90.7%
Romanians
98.9
/100
|
#85
Exceptional
90.7%
Immigrants | Bulgaria
98.9
/100
|
#86
Exceptional
90.6%
Immigrants | Turkey
98.9
/100
|
#87
Exceptional
90.6%
Immigrants | France
98.8
/100
|
#88
Exceptional
90.6%
Canadians
98.7
/100
|
#89
Exceptional
90.6%

Demographics Similar to Immigrants from Sierra Leone by High School Diploma

In terms of high school diploma, the demographic groups most similar to Immigrants from Sierra Leone are Arapaho (88.6%, a difference of 0.010%), Immigrants from Micronesia (88.6%, a difference of 0.020%), Armenian (88.6%, a difference of 0.040%), Portuguese (88.5%, a difference of 0.040%), and Cherokee (88.5%, a difference of 0.040%).
DemographicsRating | RankHigh School Diploma
Hawaiians
18.3
/100
|
#200
Poor
88.6%
Koreans
18.1
/100
|
#201
Poor
88.6%
Panamanians
18.0
/100
|
#202
Poor
88.6%
Somalis
17.5
/100
|
#203
Poor
88.6%
Armenians
17.2
/100
|
#204
Poor
88.6%
Immigrants | Micronesia
16.4
/100
|
#205
Poor
88.6%
Arapaho
16.1
/100
|
#206
Poor
88.6%
Immigrants | Sierra Leone
15.8
/100
|
#207
Poor
88.6%
Portuguese
14.4
/100
|
#208
Poor
88.5%
Cherokee
14.3
/100
|
#209
Poor
88.5%
Samoans
14.0
/100
|
#210
Poor
88.5%
Inupiat
13.1
/100
|
#211
Poor
88.5%
South American Indians
12.2
/100
|
#212
Poor
88.5%
Immigrants | Somalia
11.3
/100
|
#213
Poor
88.4%
Immigrants | Cameroon
10.9
/100
|
#214
Poor
88.4%