Scotch-Irish vs Immigrants from Congo High School Diploma
COMPARE
Scotch-Irish
Immigrants from Congo
High School Diploma
High School Diploma Comparison
Scotch-Irish
Immigrants from Congo
90.8%
HIGH SCHOOL DIPLOMA
99.2/ 100
METRIC RATING
82nd/ 347
METRIC RANK
87.0%
HIGH SCHOOL DIPLOMA
0.2/ 100
METRIC RATING
266th/ 347
METRIC RANK
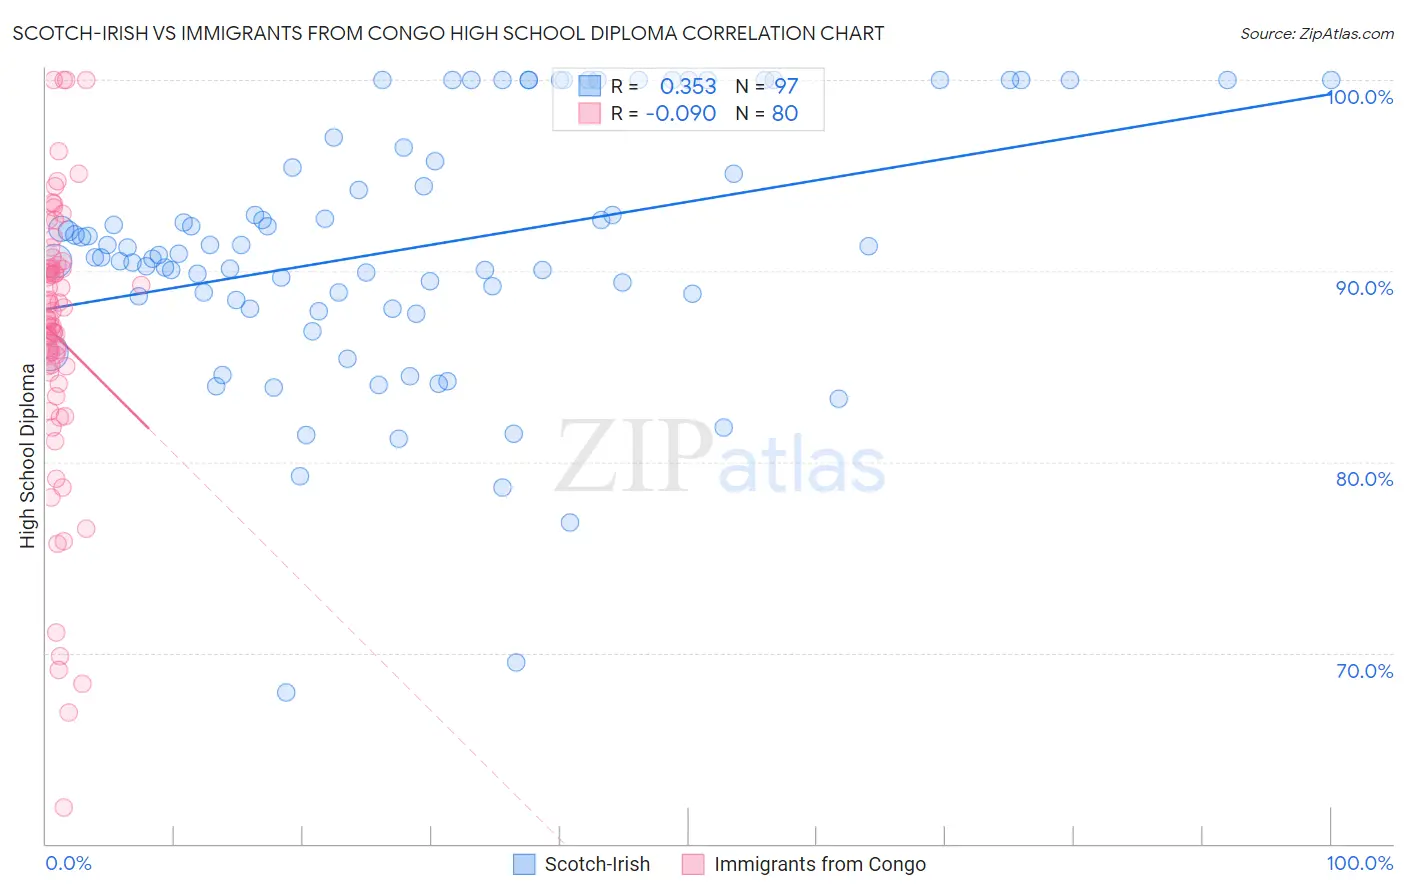
Scotch-Irish vs Immigrants from Congo High School Diploma Correlation Chart
The statistical analysis conducted on geographies consisting of 548,780,422 people shows a mild positive correlation between the proportion of Scotch-Irish and percentage of population with at least high school diploma education in the United States with a correlation coefficient (R) of 0.353 and weighted average of 90.8%. Similarly, the statistical analysis conducted on geographies consisting of 92,134,351 people shows a slight negative correlation between the proportion of Immigrants from Congo and percentage of population with at least high school diploma education in the United States with a correlation coefficient (R) of -0.090 and weighted average of 87.0%, a difference of 4.3%.
High School Diploma Correlation Summary
| Measurement | Scotch-Irish | Immigrants from Congo |
| Minimum | 67.9% | 61.9% |
| Maximum | 100.0% | 100.0% |
| Range | 32.1% | 38.1% |
| Mean | 91.2% | 86.5% |
| Median | 90.9% | 87.5% |
| Interquartile 25% (IQ1) | 88.2% | 84.8% |
| Interquartile 75% (IQ3) | 96.1% | 90.2% |
| Interquartile Range (IQR) | 7.9% | 5.3% |
| Standard Deviation (Sample) | 6.7% | 7.4% |
| Standard Deviation (Population) | 6.7% | 7.4% |
Similar Demographics by High School Diploma
Demographics Similar to Scotch-Irish by High School Diploma
In terms of high school diploma, the demographic groups most similar to Scotch-Irish are Immigrants from Moldova (90.7%, a difference of 0.020%), Immigrants from England (90.8%, a difference of 0.040%), Immigrants from Switzerland (90.8%, a difference of 0.040%), Immigrants from Denmark (90.8%, a difference of 0.050%), and Immigrants from Saudi Arabia (90.7%, a difference of 0.050%).
| Demographics | Rating | Rank | High School Diploma |
| Cambodians | 99.4 /100 | #75 | Exceptional 90.8% |
| Hungarians | 99.3 /100 | #76 | Exceptional 90.8% |
| Native Hawaiians | 99.3 /100 | #77 | Exceptional 90.8% |
| Burmese | 99.3 /100 | #78 | Exceptional 90.8% |
| Immigrants | Denmark | 99.3 /100 | #79 | Exceptional 90.8% |
| Immigrants | England | 99.3 /100 | #80 | Exceptional 90.8% |
| Immigrants | Switzerland | 99.3 /100 | #81 | Exceptional 90.8% |
| Scotch-Irish | 99.2 /100 | #82 | Exceptional 90.8% |
| Immigrants | Moldova | 99.2 /100 | #83 | Exceptional 90.7% |
| Immigrants | Saudi Arabia | 99.1 /100 | #84 | Exceptional 90.7% |
| Romanians | 98.9 /100 | #85 | Exceptional 90.7% |
| Immigrants | Bulgaria | 98.9 /100 | #86 | Exceptional 90.6% |
| Immigrants | Turkey | 98.9 /100 | #87 | Exceptional 90.6% |
| Immigrants | France | 98.8 /100 | #88 | Exceptional 90.6% |
| Canadians | 98.7 /100 | #89 | Exceptional 90.6% |
Demographics Similar to Immigrants from Congo by High School Diploma
In terms of high school diploma, the demographic groups most similar to Immigrants from Congo are Black/African American (87.0%, a difference of 0.010%), U.S. Virgin Islander (87.1%, a difference of 0.050%), Pennsylvania German (87.0%, a difference of 0.050%), Sri Lankan (87.0%, a difference of 0.050%), and Malaysian (87.0%, a difference of 0.070%).
| Demographics | Rating | Rank | High School Diploma |
| Immigrants | Western Africa | 0.5 /100 | #259 | Tragic 87.4% |
| Cajuns | 0.4 /100 | #260 | Tragic 87.3% |
| Seminole | 0.4 /100 | #261 | Tragic 87.3% |
| Immigrants | Peru | 0.4 /100 | #262 | Tragic 87.3% |
| Immigrants | South Eastern Asia | 0.3 /100 | #263 | Tragic 87.2% |
| Jamaicans | 0.3 /100 | #264 | Tragic 87.2% |
| U.S. Virgin Islanders | 0.2 /100 | #265 | Tragic 87.1% |
| Immigrants | Congo | 0.2 /100 | #266 | Tragic 87.0% |
| Blacks/African Americans | 0.2 /100 | #267 | Tragic 87.0% |
| Pennsylvania Germans | 0.2 /100 | #268 | Tragic 87.0% |
| Sri Lankans | 0.2 /100 | #269 | Tragic 87.0% |
| Malaysians | 0.2 /100 | #270 | Tragic 87.0% |
| West Indians | 0.1 /100 | #271 | Tragic 86.9% |
| Trinidadians and Tobagonians | 0.1 /100 | #272 | Tragic 86.9% |
| Immigrants | Jamaica | 0.1 /100 | #273 | Tragic 86.9% |