Scandinavian vs Japanese Professional Degree
COMPARE
Scandinavian
Japanese
Professional Degree
Professional Degree Comparison
Scandinavians
Japanese
4.2%
PROFESSIONAL DEGREE
25.8/ 100
METRIC RATING
194th/ 347
METRIC RANK
3.5%
PROFESSIONAL DEGREE
0.5/ 100
METRIC RATING
278th/ 347
METRIC RANK
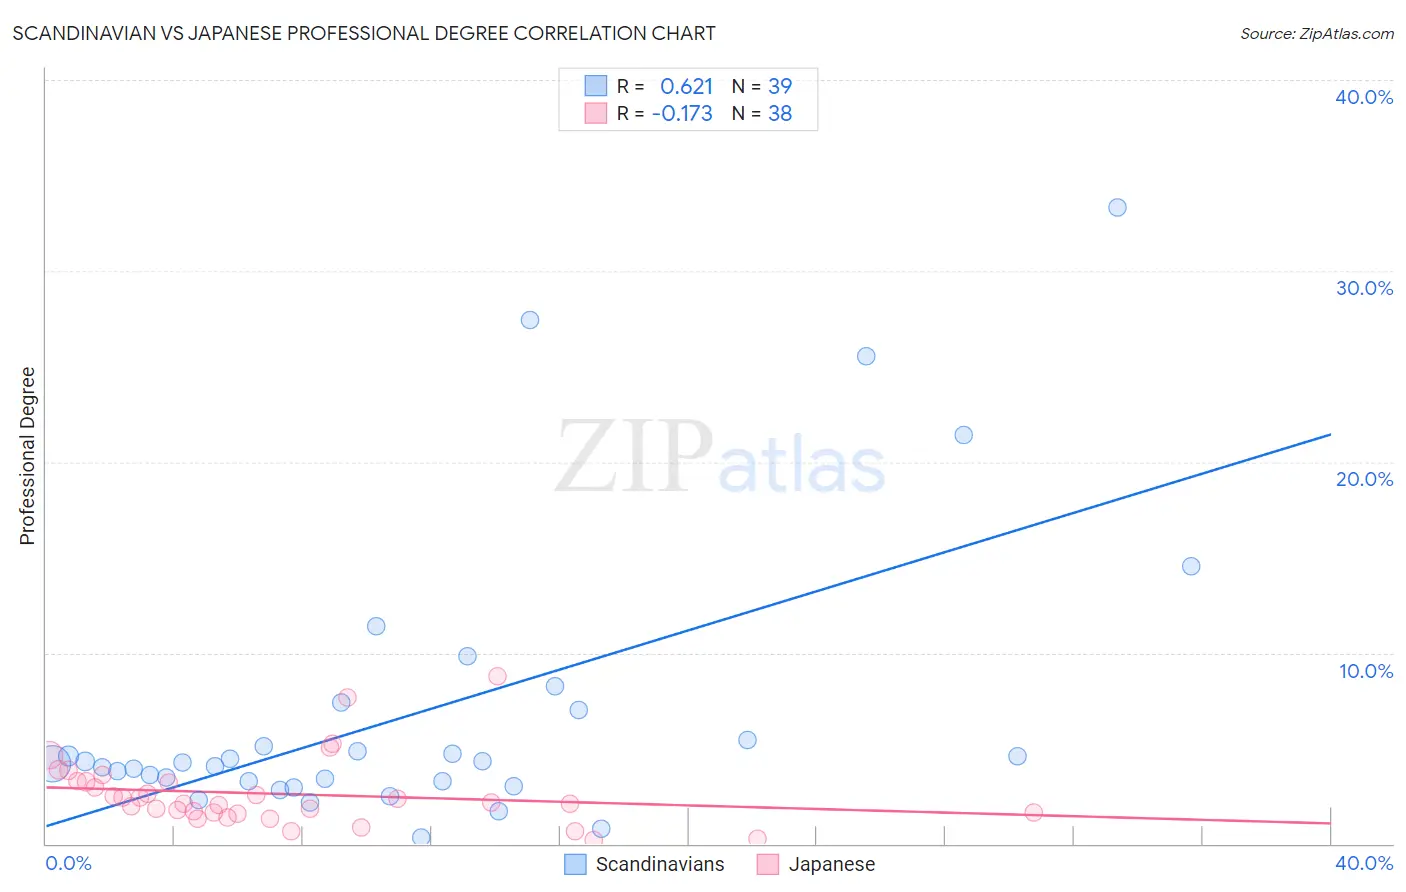
Scandinavian vs Japanese Professional Degree Correlation Chart
The statistical analysis conducted on geographies consisting of 469,840,840 people shows a significant positive correlation between the proportion of Scandinavians and percentage of population with at least professional degree education in the United States with a correlation coefficient (R) of 0.621 and weighted average of 4.2%. Similarly, the statistical analysis conducted on geographies consisting of 248,858,798 people shows a poor negative correlation between the proportion of Japanese and percentage of population with at least professional degree education in the United States with a correlation coefficient (R) of -0.173 and weighted average of 3.5%, a difference of 19.4%.
Professional Degree Correlation Summary
| Measurement | Scandinavian | Japanese |
| Minimum | 0.33% | 0.20% |
| Maximum | 33.3% | 8.8% |
| Range | 33.0% | 8.6% |
| Mean | 6.9% | 2.6% |
| Median | 4.2% | 2.1% |
| Interquartile 25% (IQ1) | 3.3% | 1.6% |
| Interquartile 75% (IQ3) | 7.0% | 3.2% |
| Interquartile Range (IQR) | 3.8% | 1.6% |
| Standard Deviation (Sample) | 7.5% | 1.8% |
| Standard Deviation (Population) | 7.4% | 1.8% |
Similar Demographics by Professional Degree
Demographics Similar to Scandinavians by Professional Degree
In terms of professional degree, the demographic groups most similar to Scandinavians are Nigerian (4.2%, a difference of 0.24%), French (4.2%, a difference of 0.25%), Ghanaian (4.3%, a difference of 0.29%), Spanish (4.2%, a difference of 0.57%), and Sri Lankan (4.3%, a difference of 0.62%).
| Demographics | Rating | Rank | Professional Degree |
| Immigrants | Cameroon | 33.3 /100 | #187 | Fair 4.3% |
| Immigrants | Thailand | 31.7 /100 | #188 | Fair 4.3% |
| Slovaks | 30.7 /100 | #189 | Fair 4.3% |
| Immigrants | Poland | 29.2 /100 | #190 | Fair 4.3% |
| Sri Lankans | 29.0 /100 | #191 | Fair 4.3% |
| Ghanaians | 27.3 /100 | #192 | Fair 4.3% |
| French | 27.1 /100 | #193 | Fair 4.2% |
| Scandinavians | 25.8 /100 | #194 | Fair 4.2% |
| Nigerians | 24.6 /100 | #195 | Fair 4.2% |
| Spanish | 23.0 /100 | #196 | Fair 4.2% |
| Czechoslovakians | 22.4 /100 | #197 | Fair 4.2% |
| Immigrants | Middle Africa | 22.1 /100 | #198 | Fair 4.2% |
| Norwegians | 20.5 /100 | #199 | Fair 4.2% |
| Immigrants | North Macedonia | 20.2 /100 | #200 | Fair 4.2% |
| Finns | 18.7 /100 | #201 | Poor 4.2% |
Demographics Similar to Japanese by Professional Degree
In terms of professional degree, the demographic groups most similar to Japanese are Immigrants from Portugal (3.5%, a difference of 0.040%), Cheyenne (3.6%, a difference of 0.060%), Liberian (3.6%, a difference of 0.070%), Dominican (3.5%, a difference of 0.080%), and Apache (3.5%, a difference of 0.10%).
| Demographics | Rating | Rank | Professional Degree |
| Belizeans | 0.5 /100 | #271 | Tragic 3.6% |
| Immigrants | Jamaica | 0.5 /100 | #272 | Tragic 3.6% |
| Americans | 0.5 /100 | #273 | Tragic 3.6% |
| Potawatomi | 0.5 /100 | #274 | Tragic 3.6% |
| Immigrants | Dominica | 0.5 /100 | #275 | Tragic 3.6% |
| Liberians | 0.5 /100 | #276 | Tragic 3.6% |
| Cheyenne | 0.5 /100 | #277 | Tragic 3.6% |
| Japanese | 0.5 /100 | #278 | Tragic 3.5% |
| Immigrants | Portugal | 0.5 /100 | #279 | Tragic 3.5% |
| Dominicans | 0.5 /100 | #280 | Tragic 3.5% |
| Apache | 0.5 /100 | #281 | Tragic 3.5% |
| Immigrants | Caribbean | 0.5 /100 | #282 | Tragic 3.5% |
| Comanche | 0.4 /100 | #283 | Tragic 3.5% |
| Salvadorans | 0.4 /100 | #284 | Tragic 3.5% |
| Hondurans | 0.3 /100 | #285 | Tragic 3.5% |