Immigrants from Yemen vs Japanese Professional Degree
COMPARE
Immigrants from Yemen
Japanese
Professional Degree
Professional Degree Comparison
Immigrants from Yemen
Japanese
3.4%
PROFESSIONAL DEGREE
0.2/ 100
METRIC RATING
299th/ 347
METRIC RANK
3.5%
PROFESSIONAL DEGREE
0.5/ 100
METRIC RATING
278th/ 347
METRIC RANK
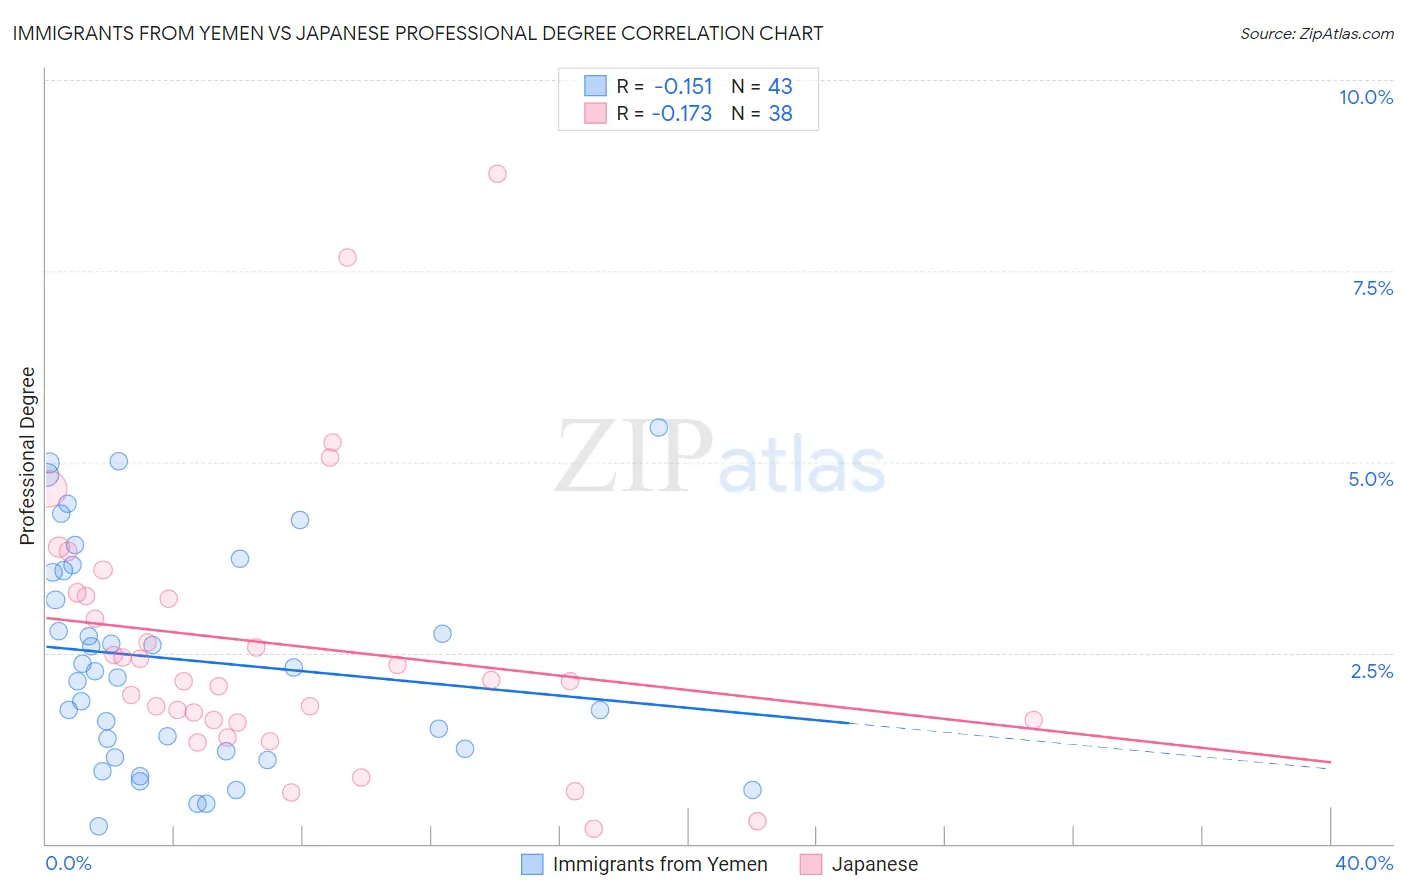
Immigrants from Yemen vs Japanese Professional Degree Correlation Chart
The statistical analysis conducted on geographies consisting of 82,369,214 people shows a poor negative correlation between the proportion of Immigrants from Yemen and percentage of population with at least professional degree education in the United States with a correlation coefficient (R) of -0.151 and weighted average of 3.4%. Similarly, the statistical analysis conducted on geographies consisting of 248,858,798 people shows a poor negative correlation between the proportion of Japanese and percentage of population with at least professional degree education in the United States with a correlation coefficient (R) of -0.173 and weighted average of 3.5%, a difference of 4.2%.
Professional Degree Correlation Summary
| Measurement | Immigrants from Yemen | Japanese |
| Minimum | 0.23% | 0.20% |
| Maximum | 5.4% | 8.8% |
| Range | 5.2% | 8.6% |
| Mean | 2.4% | 2.6% |
| Median | 2.3% | 2.1% |
| Interquartile 25% (IQ1) | 1.2% | 1.6% |
| Interquartile 75% (IQ3) | 3.6% | 3.2% |
| Interquartile Range (IQR) | 2.4% | 1.6% |
| Standard Deviation (Sample) | 1.4% | 1.8% |
| Standard Deviation (Population) | 1.4% | 1.8% |
Similar Demographics by Professional Degree
Demographics Similar to Immigrants from Yemen by Professional Degree
In terms of professional degree, the demographic groups most similar to Immigrants from Yemen are Black/African American (3.4%, a difference of 0.13%), Immigrants from Dominican Republic (3.4%, a difference of 0.28%), Malaysian (3.4%, a difference of 0.38%), Ottawa (3.4%, a difference of 0.67%), and Immigrants from Liberia (3.4%, a difference of 0.72%).
| Demographics | Rating | Rank | Professional Degree |
| Immigrants | Belize | 0.3 /100 | #292 | Tragic 3.5% |
| Immigrants | Honduras | 0.3 /100 | #293 | Tragic 3.5% |
| Paiute | 0.3 /100 | #294 | Tragic 3.4% |
| Immigrants | Guatemala | 0.2 /100 | #295 | Tragic 3.4% |
| Hawaiians | 0.2 /100 | #296 | Tragic 3.4% |
| Immigrants | Liberia | 0.2 /100 | #297 | Tragic 3.4% |
| Ottawa | 0.2 /100 | #298 | Tragic 3.4% |
| Immigrants | Yemen | 0.2 /100 | #299 | Tragic 3.4% |
| Blacks/African Americans | 0.2 /100 | #300 | Tragic 3.4% |
| Immigrants | Dominican Republic | 0.2 /100 | #301 | Tragic 3.4% |
| Malaysians | 0.2 /100 | #302 | Tragic 3.4% |
| Immigrants | Haiti | 0.2 /100 | #303 | Tragic 3.4% |
| Cajuns | 0.2 /100 | #304 | Tragic 3.4% |
| Chickasaw | 0.1 /100 | #305 | Tragic 3.4% |
| Cape Verdeans | 0.1 /100 | #306 | Tragic 3.4% |
Demographics Similar to Japanese by Professional Degree
In terms of professional degree, the demographic groups most similar to Japanese are Immigrants from Portugal (3.5%, a difference of 0.040%), Cheyenne (3.6%, a difference of 0.060%), Liberian (3.6%, a difference of 0.070%), Dominican (3.5%, a difference of 0.080%), and Apache (3.5%, a difference of 0.10%).
| Demographics | Rating | Rank | Professional Degree |
| Belizeans | 0.5 /100 | #271 | Tragic 3.6% |
| Immigrants | Jamaica | 0.5 /100 | #272 | Tragic 3.6% |
| Americans | 0.5 /100 | #273 | Tragic 3.6% |
| Potawatomi | 0.5 /100 | #274 | Tragic 3.6% |
| Immigrants | Dominica | 0.5 /100 | #275 | Tragic 3.6% |
| Liberians | 0.5 /100 | #276 | Tragic 3.6% |
| Cheyenne | 0.5 /100 | #277 | Tragic 3.6% |
| Japanese | 0.5 /100 | #278 | Tragic 3.5% |
| Immigrants | Portugal | 0.5 /100 | #279 | Tragic 3.5% |
| Dominicans | 0.5 /100 | #280 | Tragic 3.5% |
| Apache | 0.5 /100 | #281 | Tragic 3.5% |
| Immigrants | Caribbean | 0.5 /100 | #282 | Tragic 3.5% |
| Comanche | 0.4 /100 | #283 | Tragic 3.5% |
| Salvadorans | 0.4 /100 | #284 | Tragic 3.5% |
| Hondurans | 0.3 /100 | #285 | Tragic 3.5% |