Romanian vs Immigrants from Spain No Schooling Completed
COMPARE
Romanian
Immigrants from Spain
No Schooling Completed
No Schooling Completed Comparison
Romanians
Immigrants from Spain
1.8%
NO SCHOOLING COMPLETED
98.8/ 100
METRIC RATING
92nd/ 347
METRIC RANK
2.0%
NO SCHOOLING COMPLETED
66.4/ 100
METRIC RATING
159th/ 347
METRIC RANK
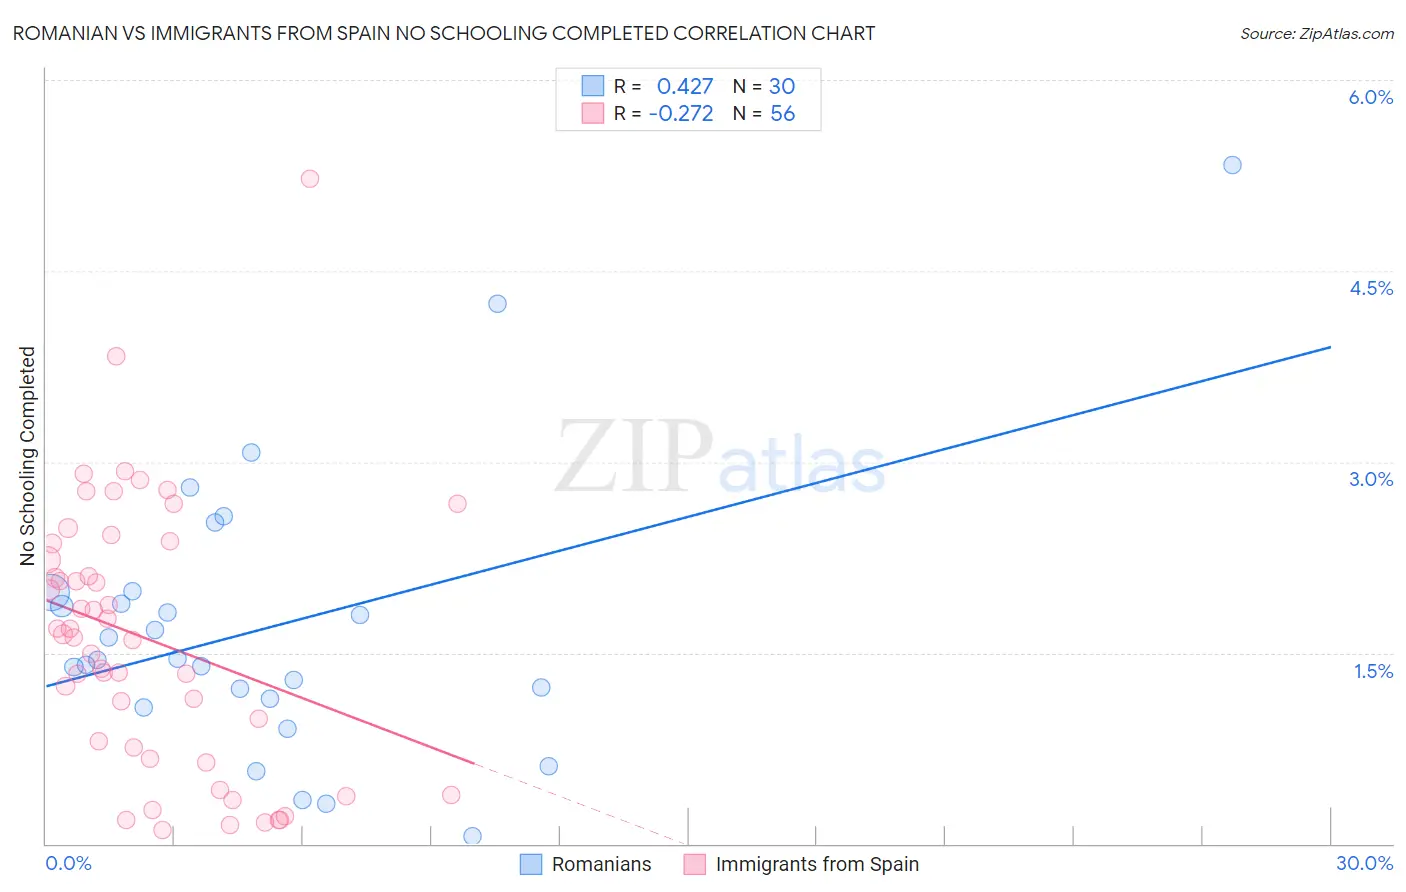
Romanian vs Immigrants from Spain No Schooling Completed Correlation Chart
The statistical analysis conducted on geographies consisting of 373,712,134 people shows a moderate positive correlation between the proportion of Romanians and percentage of population with no schooling in the United States with a correlation coefficient (R) of 0.427 and weighted average of 1.8%. Similarly, the statistical analysis conducted on geographies consisting of 238,284,767 people shows a weak negative correlation between the proportion of Immigrants from Spain and percentage of population with no schooling in the United States with a correlation coefficient (R) of -0.272 and weighted average of 2.0%, a difference of 14.7%.
No Schooling Completed Correlation Summary
| Measurement | Romanian | Immigrants from Spain |
| Minimum | 0.062% | 0.11% |
| Maximum | 5.3% | 5.2% |
| Range | 5.3% | 5.1% |
| Mean | 1.7% | 1.6% |
| Median | 1.4% | 1.6% |
| Interquartile 25% (IQ1) | 1.1% | 0.72% |
| Interquartile 75% (IQ3) | 2.0% | 2.3% |
| Interquartile Range (IQR) | 0.83% | 1.6% |
| Standard Deviation (Sample) | 1.1% | 1.0% |
| Standard Deviation (Population) | 1.1% | 1.0% |
Similar Demographics by No Schooling Completed
Demographics Similar to Romanians by No Schooling Completed
In terms of no schooling completed, the demographic groups most similar to Romanians are Turkish (1.8%, a difference of 0.37%), Immigrants from Germany (1.8%, a difference of 0.52%), Sioux (1.8%, a difference of 0.62%), Nonimmigrants (1.8%, a difference of 0.87%), and Puget Sound Salish (1.8%, a difference of 0.88%).
| Demographics | Rating | Rank | No Schooling Completed |
| Immigrants | Australia | 99.2 /100 | #85 | Exceptional 1.7% |
| Ukrainians | 99.2 /100 | #86 | Exceptional 1.8% |
| Osage | 99.2 /100 | #87 | Exceptional 1.8% |
| Immigrants | Western Europe | 99.2 /100 | #88 | Exceptional 1.8% |
| South Africans | 99.1 /100 | #89 | Exceptional 1.8% |
| Sioux | 99.0 /100 | #90 | Exceptional 1.8% |
| Immigrants | Germany | 99.0 /100 | #91 | Exceptional 1.8% |
| Romanians | 98.8 /100 | #92 | Exceptional 1.8% |
| Turks | 98.7 /100 | #93 | Exceptional 1.8% |
| Immigrants | Nonimmigrants | 98.5 /100 | #94 | Exceptional 1.8% |
| Puget Sound Salish | 98.5 /100 | #95 | Exceptional 1.8% |
| Bhutanese | 98.4 /100 | #96 | Exceptional 1.8% |
| Immigrants | Ireland | 98.4 /100 | #97 | Exceptional 1.8% |
| Iranians | 98.2 /100 | #98 | Exceptional 1.8% |
| Choctaw | 98.1 /100 | #99 | Exceptional 1.8% |
Demographics Similar to Immigrants from Spain by No Schooling Completed
In terms of no schooling completed, the demographic groups most similar to Immigrants from Spain are Immigrants from Korea (2.0%, a difference of 0.050%), Immigrants from Sri Lanka (2.0%, a difference of 0.090%), Chilean (2.0%, a difference of 0.12%), Kenyan (2.0%, a difference of 0.12%), and Immigrants from Russia (2.0%, a difference of 0.19%).
| Demographics | Rating | Rank | No Schooling Completed |
| Immigrants | Eastern Europe | 70.4 /100 | #152 | Good 2.0% |
| Immigrants | Italy | 68.9 /100 | #153 | Good 2.0% |
| Immigrants | Venezuela | 68.5 /100 | #154 | Good 2.0% |
| Immigrants | Russia | 67.6 /100 | #155 | Good 2.0% |
| Chileans | 67.2 /100 | #156 | Good 2.0% |
| Immigrants | Sri Lanka | 67.0 /100 | #157 | Good 2.0% |
| Immigrants | Korea | 66.7 /100 | #158 | Good 2.0% |
| Immigrants | Spain | 66.4 /100 | #159 | Good 2.0% |
| Kenyans | 65.7 /100 | #160 | Good 2.0% |
| Ugandans | 64.6 /100 | #161 | Good 2.0% |
| Immigrants | Brazil | 63.8 /100 | #162 | Good 2.1% |
| Albanians | 62.2 /100 | #163 | Good 2.1% |
| Comanche | 60.7 /100 | #164 | Good 2.1% |
| Brazilians | 60.2 /100 | #165 | Good 2.1% |
| Dutch West Indians | 59.9 /100 | #166 | Average 2.1% |