Romanian vs Immigrants from Croatia No Schooling Completed
COMPARE
Romanian
Immigrants from Croatia
No Schooling Completed
No Schooling Completed Comparison
Romanians
Immigrants from Croatia
1.8%
NO SCHOOLING COMPLETED
98.8/ 100
METRIC RATING
92nd/ 347
METRIC RANK
1.9%
NO SCHOOLING COMPLETED
94.5/ 100
METRIC RATING
121st/ 347
METRIC RANK
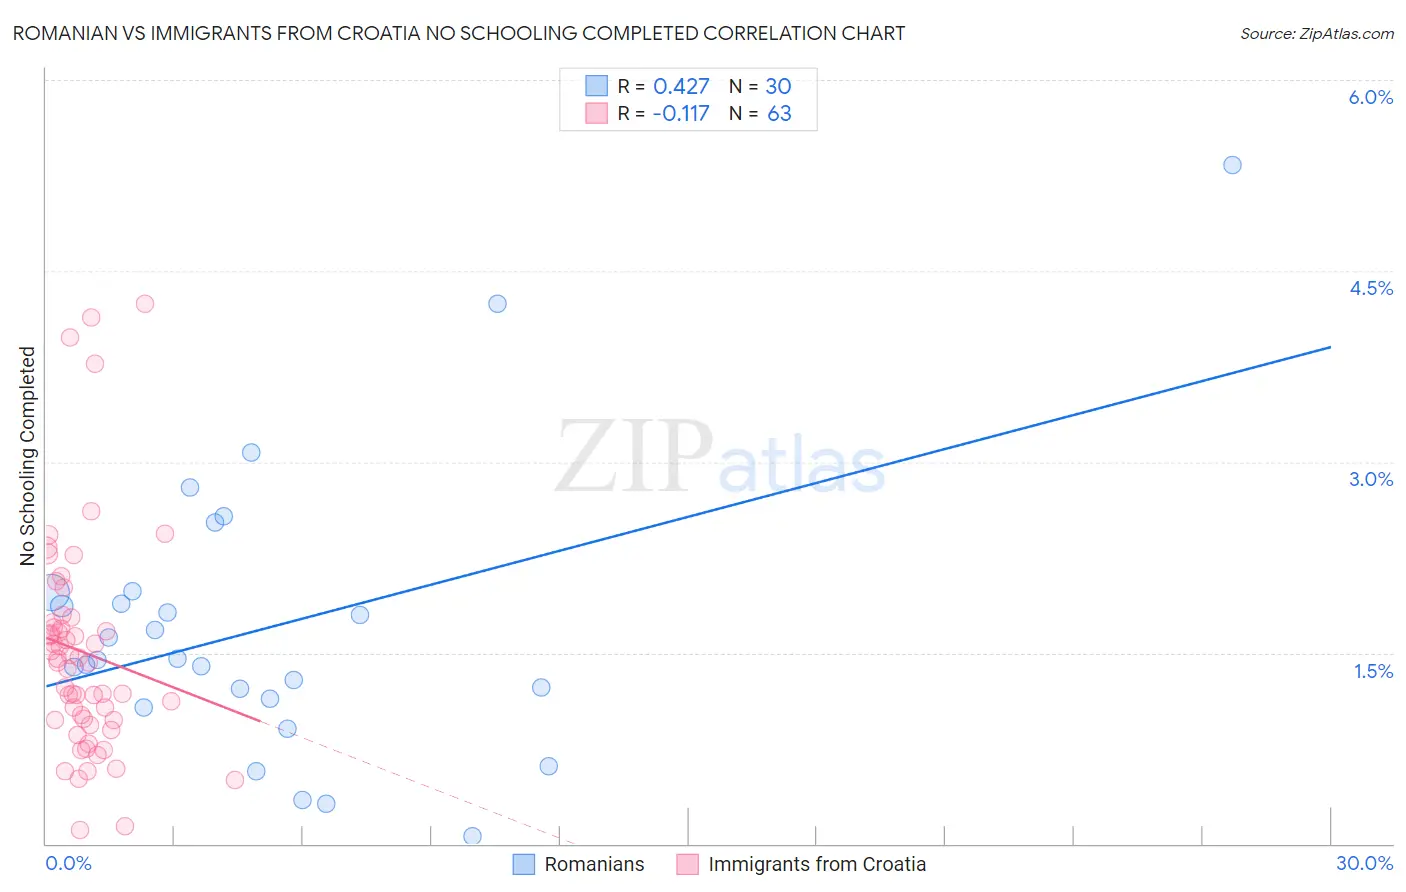
Romanian vs Immigrants from Croatia No Schooling Completed Correlation Chart
The statistical analysis conducted on geographies consisting of 373,712,134 people shows a moderate positive correlation between the proportion of Romanians and percentage of population with no schooling in the United States with a correlation coefficient (R) of 0.427 and weighted average of 1.8%. Similarly, the statistical analysis conducted on geographies consisting of 132,073,413 people shows a poor negative correlation between the proportion of Immigrants from Croatia and percentage of population with no schooling in the United States with a correlation coefficient (R) of -0.117 and weighted average of 1.9%, a difference of 6.2%.
No Schooling Completed Correlation Summary
| Measurement | Romanian | Immigrants from Croatia |
| Minimum | 0.062% | 0.11% |
| Maximum | 5.3% | 4.2% |
| Range | 5.3% | 4.1% |
| Mean | 1.7% | 1.5% |
| Median | 1.4% | 1.4% |
| Interquartile 25% (IQ1) | 1.1% | 0.97% |
| Interquartile 75% (IQ3) | 2.0% | 1.7% |
| Interquartile Range (IQR) | 0.83% | 0.77% |
| Standard Deviation (Sample) | 1.1% | 0.87% |
| Standard Deviation (Population) | 1.1% | 0.86% |
Similar Demographics by No Schooling Completed
Demographics Similar to Romanians by No Schooling Completed
In terms of no schooling completed, the demographic groups most similar to Romanians are Turkish (1.8%, a difference of 0.37%), Immigrants from Germany (1.8%, a difference of 0.52%), Sioux (1.8%, a difference of 0.62%), Nonimmigrants (1.8%, a difference of 0.87%), and Puget Sound Salish (1.8%, a difference of 0.88%).
| Demographics | Rating | Rank | No Schooling Completed |
| Immigrants | Australia | 99.2 /100 | #85 | Exceptional 1.7% |
| Ukrainians | 99.2 /100 | #86 | Exceptional 1.8% |
| Osage | 99.2 /100 | #87 | Exceptional 1.8% |
| Immigrants | Western Europe | 99.2 /100 | #88 | Exceptional 1.8% |
| South Africans | 99.1 /100 | #89 | Exceptional 1.8% |
| Sioux | 99.0 /100 | #90 | Exceptional 1.8% |
| Immigrants | Germany | 99.0 /100 | #91 | Exceptional 1.8% |
| Romanians | 98.8 /100 | #92 | Exceptional 1.8% |
| Turks | 98.7 /100 | #93 | Exceptional 1.8% |
| Immigrants | Nonimmigrants | 98.5 /100 | #94 | Exceptional 1.8% |
| Puget Sound Salish | 98.5 /100 | #95 | Exceptional 1.8% |
| Bhutanese | 98.4 /100 | #96 | Exceptional 1.8% |
| Immigrants | Ireland | 98.4 /100 | #97 | Exceptional 1.8% |
| Iranians | 98.2 /100 | #98 | Exceptional 1.8% |
| Choctaw | 98.1 /100 | #99 | Exceptional 1.8% |
Demographics Similar to Immigrants from Croatia by No Schooling Completed
In terms of no schooling completed, the demographic groups most similar to Immigrants from Croatia are Cree (1.9%, a difference of 0.030%), Immigrants from Bulgaria (1.9%, a difference of 0.060%), Immigrants from Kuwait (1.9%, a difference of 0.39%), Iroquois (1.9%, a difference of 0.47%), and Cambodian (1.9%, a difference of 0.47%).
| Demographics | Rating | Rank | No Schooling Completed |
| Immigrants | Norway | 96.1 /100 | #114 | Exceptional 1.9% |
| Syrians | 96.0 /100 | #115 | Exceptional 1.9% |
| Lebanese | 96.0 /100 | #116 | Exceptional 1.9% |
| Immigrants | Serbia | 95.8 /100 | #117 | Exceptional 1.9% |
| Spanish | 95.5 /100 | #118 | Exceptional 1.9% |
| Iroquois | 95.1 /100 | #119 | Exceptional 1.9% |
| Immigrants | Bulgaria | 94.6 /100 | #120 | Exceptional 1.9% |
| Immigrants | Croatia | 94.5 /100 | #121 | Exceptional 1.9% |
| Cree | 94.5 /100 | #122 | Exceptional 1.9% |
| Immigrants | Kuwait | 93.9 /100 | #123 | Exceptional 1.9% |
| Cambodians | 93.8 /100 | #124 | Exceptional 1.9% |
| Immigrants | Europe | 93.7 /100 | #125 | Exceptional 1.9% |
| Immigrants | Romania | 92.6 /100 | #126 | Exceptional 1.9% |
| Israelis | 92.4 /100 | #127 | Exceptional 1.9% |
| Spaniards | 92.3 /100 | #128 | Exceptional 1.9% |