Puget Sound Salish vs Guyanese Bachelor's Degree
COMPARE
Puget Sound Salish
Guyanese
Bachelor's Degree
Bachelor's Degree Comparison
Puget Sound Salish
Guyanese
30.7%
BACHELOR'S DEGREE
0.0/ 100
METRIC RATING
296th/ 347
METRIC RANK
34.5%
BACHELOR'S DEGREE
2.5/ 100
METRIC RATING
238th/ 347
METRIC RANK
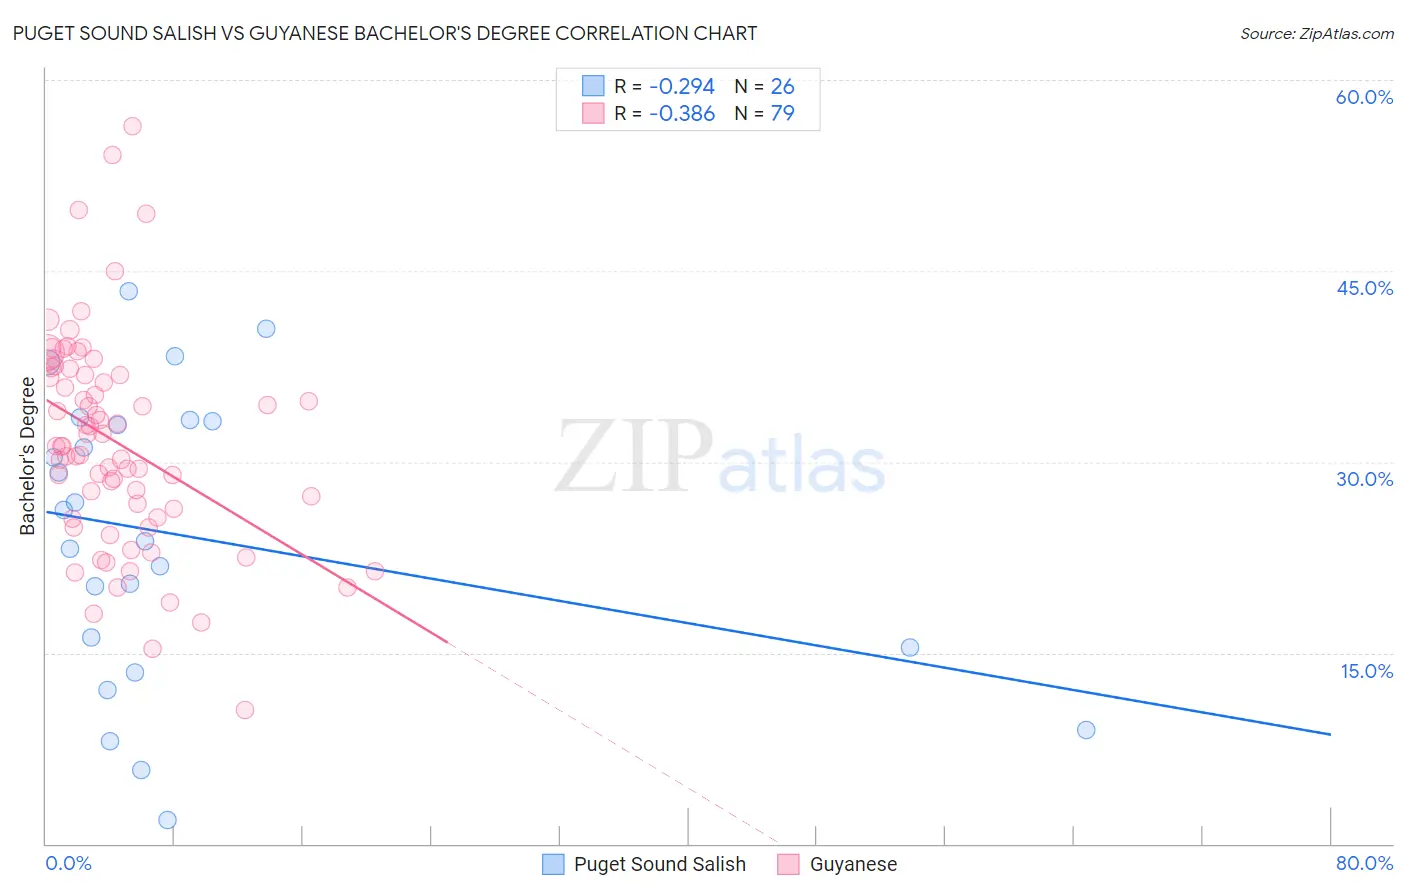
Puget Sound Salish vs Guyanese Bachelor's Degree Correlation Chart
The statistical analysis conducted on geographies consisting of 46,155,865 people shows a weak negative correlation between the proportion of Puget Sound Salish and percentage of population with at least bachelor's degree education in the United States with a correlation coefficient (R) of -0.294 and weighted average of 30.7%. Similarly, the statistical analysis conducted on geographies consisting of 176,919,737 people shows a mild negative correlation between the proportion of Guyanese and percentage of population with at least bachelor's degree education in the United States with a correlation coefficient (R) of -0.386 and weighted average of 34.5%, a difference of 12.4%.
Bachelor's Degree Correlation Summary
| Measurement | Puget Sound Salish | Guyanese |
| Minimum | 1.9% | 10.5% |
| Maximum | 43.4% | 56.4% |
| Range | 41.6% | 45.9% |
| Mean | 24.1% | 31.5% |
| Median | 25.0% | 31.2% |
| Interquartile 25% (IQ1) | 15.4% | 25.6% |
| Interquartile 75% (IQ3) | 33.2% | 36.9% |
| Interquartile Range (IQR) | 17.8% | 11.3% |
| Standard Deviation (Sample) | 11.4% | 8.4% |
| Standard Deviation (Population) | 11.2% | 8.4% |
Similar Demographics by Bachelor's Degree
Demographics Similar to Puget Sound Salish by Bachelor's Degree
In terms of bachelor's degree, the demographic groups most similar to Puget Sound Salish are Immigrants from Haiti (30.6%, a difference of 0.060%), Immigrants from Dominican Republic (30.7%, a difference of 0.10%), Chippewa (30.6%, a difference of 0.31%), Immigrants from Guatemala (30.8%, a difference of 0.34%), and Cape Verdean (30.9%, a difference of 0.74%).
| Demographics | Rating | Rank | Bachelor's Degree |
| Puerto Ricans | 0.1 /100 | #289 | Tragic 31.0% |
| Immigrants | Honduras | 0.1 /100 | #290 | Tragic 30.9% |
| Blacks/African Americans | 0.1 /100 | #291 | Tragic 30.9% |
| Ute | 0.1 /100 | #292 | Tragic 30.9% |
| Cape Verdeans | 0.1 /100 | #293 | Tragic 30.9% |
| Immigrants | Guatemala | 0.0 /100 | #294 | Tragic 30.8% |
| Immigrants | Dominican Republic | 0.0 /100 | #295 | Tragic 30.7% |
| Puget Sound Salish | 0.0 /100 | #296 | Tragic 30.7% |
| Immigrants | Haiti | 0.0 /100 | #297 | Tragic 30.6% |
| Chippewa | 0.0 /100 | #298 | Tragic 30.6% |
| Chickasaw | 0.0 /100 | #299 | Tragic 30.4% |
| Immigrants | Micronesia | 0.0 /100 | #300 | Tragic 30.4% |
| Immigrants | Cuba | 0.0 /100 | #301 | Tragic 30.3% |
| Mexican American Indians | 0.0 /100 | #302 | Tragic 30.2% |
| Bangladeshis | 0.0 /100 | #303 | Tragic 30.2% |
Demographics Similar to Guyanese by Bachelor's Degree
In terms of bachelor's degree, the demographic groups most similar to Guyanese are British West Indian (34.5%, a difference of 0.020%), Tlingit-Haida (34.6%, a difference of 0.28%), Liberian (34.6%, a difference of 0.32%), Immigrants from West Indies (34.6%, a difference of 0.43%), and Guamanian/Chamorro (34.6%, a difference of 0.52%).
| Demographics | Rating | Rank | Bachelor's Degree |
| Immigrants | St. Vincent and the Grenadines | 4.3 /100 | #231 | Tragic 35.0% |
| Hmong | 3.4 /100 | #232 | Tragic 34.8% |
| Immigrants | Ecuador | 3.3 /100 | #233 | Tragic 34.7% |
| Guamanians/Chamorros | 3.0 /100 | #234 | Tragic 34.6% |
| Immigrants | West Indies | 2.9 /100 | #235 | Tragic 34.6% |
| Liberians | 2.8 /100 | #236 | Tragic 34.6% |
| Tlingit-Haida | 2.8 /100 | #237 | Tragic 34.6% |
| Guyanese | 2.5 /100 | #238 | Tragic 34.5% |
| British West Indians | 2.5 /100 | #239 | Tragic 34.5% |
| Tongans | 2.0 /100 | #240 | Tragic 34.3% |
| Immigrants | Cambodia | 1.9 /100 | #241 | Tragic 34.2% |
| Immigrants | Nonimmigrants | 1.8 /100 | #242 | Tragic 34.2% |
| Immigrants | Guyana | 1.4 /100 | #243 | Tragic 33.9% |
| Delaware | 1.2 /100 | #244 | Tragic 33.8% |
| Immigrants | Fiji | 1.2 /100 | #245 | Tragic 33.7% |