Immigrants from Costa Rica vs Guyanese Bachelor's Degree
COMPARE
Immigrants from Costa Rica
Guyanese
Bachelor's Degree
Bachelor's Degree Comparison
Immigrants from Costa Rica
Guyanese
36.9%
BACHELOR'S DEGREE
27.4/ 100
METRIC RATING
199th/ 347
METRIC RANK
34.5%
BACHELOR'S DEGREE
2.5/ 100
METRIC RATING
238th/ 347
METRIC RANK
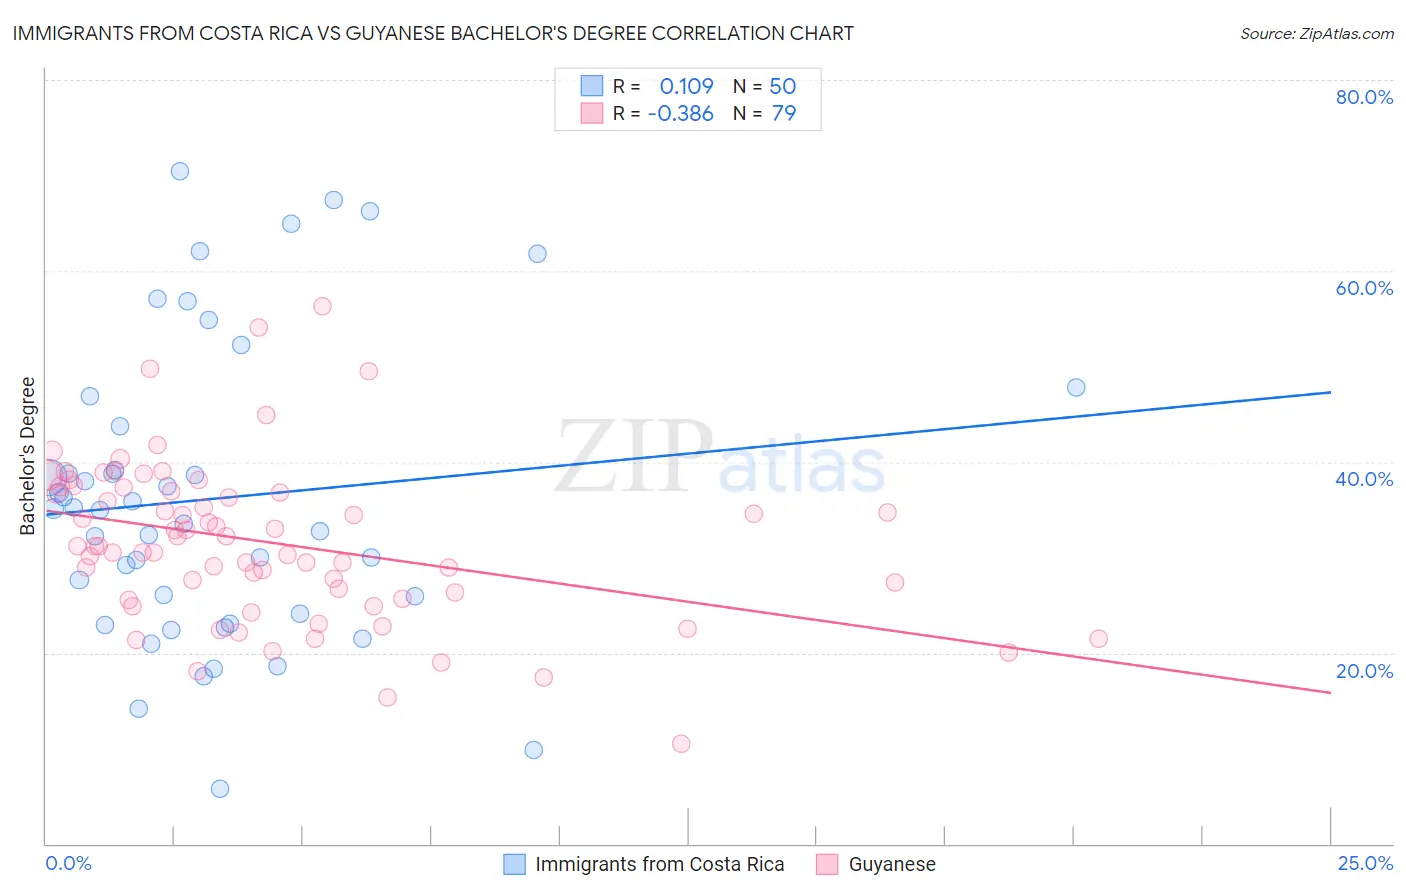
Immigrants from Costa Rica vs Guyanese Bachelor's Degree Correlation Chart
The statistical analysis conducted on geographies consisting of 204,273,479 people shows a poor positive correlation between the proportion of Immigrants from Costa Rica and percentage of population with at least bachelor's degree education in the United States with a correlation coefficient (R) of 0.109 and weighted average of 36.9%. Similarly, the statistical analysis conducted on geographies consisting of 176,919,737 people shows a mild negative correlation between the proportion of Guyanese and percentage of population with at least bachelor's degree education in the United States with a correlation coefficient (R) of -0.386 and weighted average of 34.5%, a difference of 7.2%.
Bachelor's Degree Correlation Summary
| Measurement | Immigrants from Costa Rica | Guyanese |
| Minimum | 5.7% | 10.5% |
| Maximum | 70.5% | 56.4% |
| Range | 64.7% | 45.9% |
| Mean | 36.1% | 31.5% |
| Median | 35.0% | 31.2% |
| Interquartile 25% (IQ1) | 24.1% | 25.6% |
| Interquartile 75% (IQ3) | 43.8% | 36.9% |
| Interquartile Range (IQR) | 19.7% | 11.3% |
| Standard Deviation (Sample) | 15.6% | 8.4% |
| Standard Deviation (Population) | 15.4% | 8.4% |
Similar Demographics by Bachelor's Degree
Demographics Similar to Immigrants from Costa Rica by Bachelor's Degree
In terms of bachelor's degree, the demographic groups most similar to Immigrants from Costa Rica are Immigrants from Ghana (36.9%, a difference of 0.0%), Welsh (37.0%, a difference of 0.21%), Czechoslovakian (37.0%, a difference of 0.22%), Celtic (37.0%, a difference of 0.26%), and Immigrants from South Eastern Asia (36.8%, a difference of 0.26%).
| Demographics | Rating | Rank | Bachelor's Degree |
| Immigrants | Vietnam | 32.1 /100 | #192 | Fair 37.1% |
| Yugoslavians | 31.5 /100 | #193 | Fair 37.1% |
| Belgians | 29.9 /100 | #194 | Fair 37.0% |
| Koreans | 29.8 /100 | #195 | Fair 37.0% |
| Celtics | 29.5 /100 | #196 | Fair 37.0% |
| Czechoslovakians | 29.2 /100 | #197 | Fair 37.0% |
| Welsh | 29.1 /100 | #198 | Fair 37.0% |
| Immigrants | Costa Rica | 27.4 /100 | #199 | Fair 36.9% |
| Immigrants | Ghana | 27.4 /100 | #200 | Fair 36.9% |
| Immigrants | South Eastern Asia | 25.4 /100 | #201 | Fair 36.8% |
| Immigrants | Zaire | 25.3 /100 | #202 | Fair 36.8% |
| Immigrants | Nigeria | 23.1 /100 | #203 | Fair 36.7% |
| Immigrants | Immigrants | 22.8 /100 | #204 | Fair 36.7% |
| Finns | 22.2 /100 | #205 | Fair 36.7% |
| Spaniards | 21.2 /100 | #206 | Fair 36.6% |
Demographics Similar to Guyanese by Bachelor's Degree
In terms of bachelor's degree, the demographic groups most similar to Guyanese are British West Indian (34.5%, a difference of 0.020%), Tlingit-Haida (34.6%, a difference of 0.28%), Liberian (34.6%, a difference of 0.32%), Immigrants from West Indies (34.6%, a difference of 0.43%), and Guamanian/Chamorro (34.6%, a difference of 0.52%).
| Demographics | Rating | Rank | Bachelor's Degree |
| Immigrants | St. Vincent and the Grenadines | 4.3 /100 | #231 | Tragic 35.0% |
| Hmong | 3.4 /100 | #232 | Tragic 34.8% |
| Immigrants | Ecuador | 3.3 /100 | #233 | Tragic 34.7% |
| Guamanians/Chamorros | 3.0 /100 | #234 | Tragic 34.6% |
| Immigrants | West Indies | 2.9 /100 | #235 | Tragic 34.6% |
| Liberians | 2.8 /100 | #236 | Tragic 34.6% |
| Tlingit-Haida | 2.8 /100 | #237 | Tragic 34.6% |
| Guyanese | 2.5 /100 | #238 | Tragic 34.5% |
| British West Indians | 2.5 /100 | #239 | Tragic 34.5% |
| Tongans | 2.0 /100 | #240 | Tragic 34.3% |
| Immigrants | Cambodia | 1.9 /100 | #241 | Tragic 34.2% |
| Immigrants | Nonimmigrants | 1.8 /100 | #242 | Tragic 34.2% |
| Immigrants | Guyana | 1.4 /100 | #243 | Tragic 33.9% |
| Delaware | 1.2 /100 | #244 | Tragic 33.8% |
| Immigrants | Fiji | 1.2 /100 | #245 | Tragic 33.7% |