Potawatomi vs Immigrants from Liberia 11th Grade
COMPARE
Potawatomi
Immigrants from Liberia
11th Grade
11th Grade Comparison
Potawatomi
Immigrants from Liberia
92.8%
11TH GRADE
74.3/ 100
METRIC RATING
151st/ 347
METRIC RANK
91.9%
11TH GRADE
7.0/ 100
METRIC RATING
221st/ 347
METRIC RANK
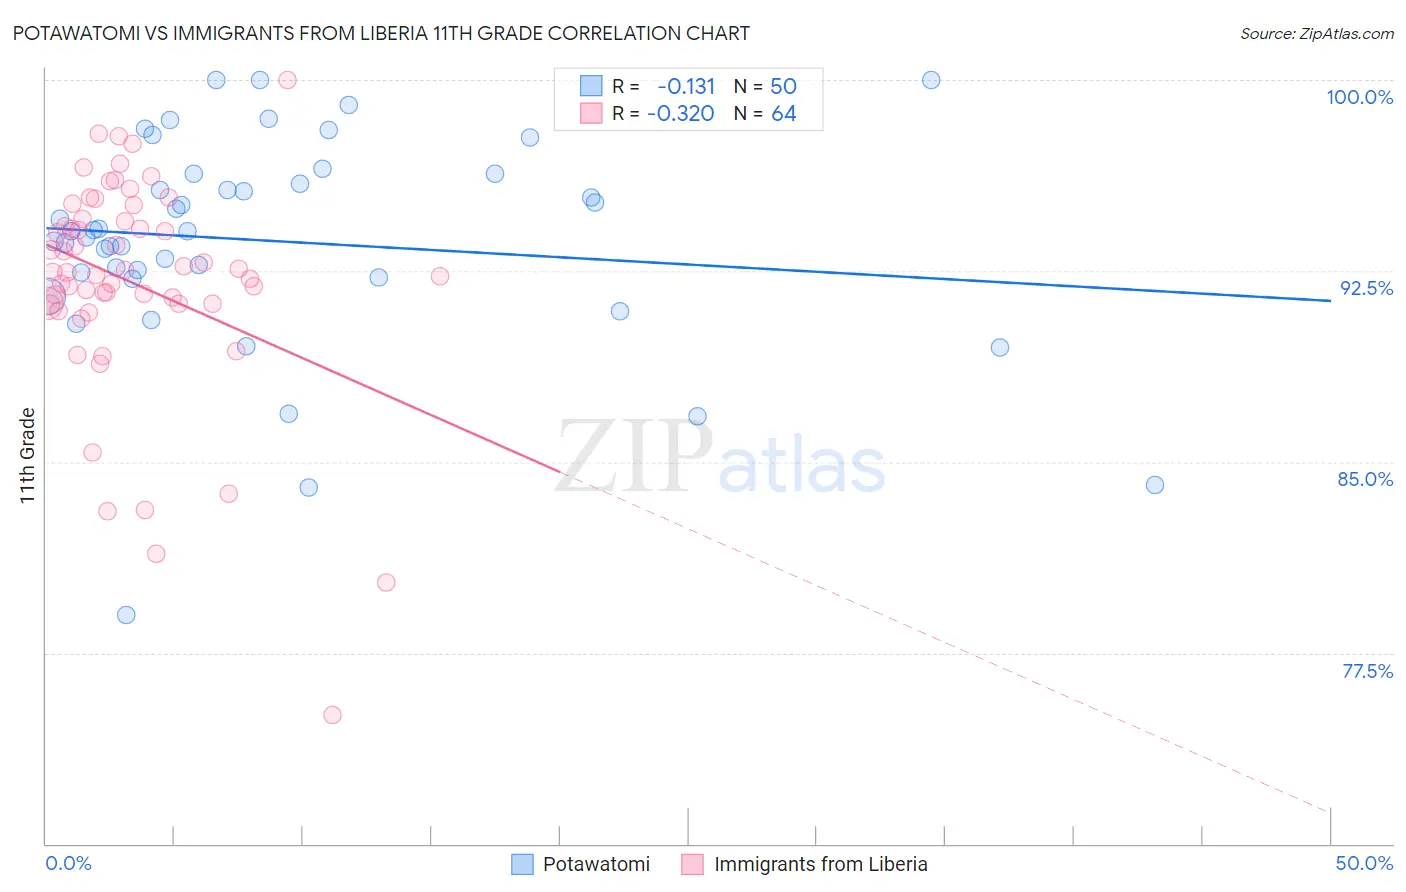
Potawatomi vs Immigrants from Liberia 11th Grade Correlation Chart
The statistical analysis conducted on geographies consisting of 117,774,178 people shows a poor negative correlation between the proportion of Potawatomi and percentage of population with at least 11th grade education in the United States with a correlation coefficient (R) of -0.131 and weighted average of 92.8%. Similarly, the statistical analysis conducted on geographies consisting of 135,293,967 people shows a mild negative correlation between the proportion of Immigrants from Liberia and percentage of population with at least 11th grade education in the United States with a correlation coefficient (R) of -0.320 and weighted average of 91.9%, a difference of 0.90%.
11th Grade Correlation Summary
| Measurement | Potawatomi | Immigrants from Liberia |
| Minimum | 79.0% | 75.1% |
| Maximum | 100.0% | 100.0% |
| Range | 21.0% | 24.9% |
| Mean | 93.7% | 92.0% |
| Median | 94.0% | 92.4% |
| Interquartile 25% (IQ1) | 92.3% | 91.2% |
| Interquartile 75% (IQ3) | 96.3% | 94.5% |
| Interquartile Range (IQR) | 4.1% | 3.3% |
| Standard Deviation (Sample) | 4.3% | 4.4% |
| Standard Deviation (Population) | 4.2% | 4.4% |
Similar Demographics by 11th Grade
Demographics Similar to Potawatomi by 11th Grade
In terms of 11th grade, the demographic groups most similar to Potawatomi are Iraqi (92.8%, a difference of 0.0%), Brazilian (92.8%, a difference of 0.0%), Osage (92.7%, a difference of 0.010%), Argentinean (92.7%, a difference of 0.010%), and Immigrants from Spain (92.7%, a difference of 0.020%).
| Demographics | Rating | Rank | 11th Grade |
| Assyrians/Chaldeans/Syriacs | 80.5 /100 | #144 | Excellent 92.8% |
| Pakistanis | 79.6 /100 | #145 | Good 92.8% |
| Iroquois | 79.1 /100 | #146 | Good 92.8% |
| Immigrants | Kenya | 78.7 /100 | #147 | Good 92.8% |
| Hmong | 78.6 /100 | #148 | Good 92.8% |
| Immigrants | Poland | 78.5 /100 | #149 | Good 92.8% |
| Immigrants | Egypt | 77.5 /100 | #150 | Good 92.8% |
| Potawatomi | 74.3 /100 | #151 | Good 92.8% |
| Iraqis | 74.2 /100 | #152 | Good 92.8% |
| Brazilians | 73.9 /100 | #153 | Good 92.8% |
| Osage | 73.4 /100 | #154 | Good 92.7% |
| Argentineans | 73.4 /100 | #155 | Good 92.7% |
| Immigrants | Spain | 73.0 /100 | #156 | Good 92.7% |
| Immigrants | Eastern Asia | 72.6 /100 | #157 | Good 92.7% |
| Immigrants | Venezuela | 72.0 /100 | #158 | Good 92.7% |
Demographics Similar to Immigrants from Liberia by 11th Grade
In terms of 11th grade, the demographic groups most similar to Immigrants from Liberia are South American Indian (92.0%, a difference of 0.020%), Immigrants from Africa (91.9%, a difference of 0.020%), Immigrants from Bahamas (91.9%, a difference of 0.020%), Costa Rican (91.9%, a difference of 0.030%), and Immigrants from Zaire (91.9%, a difference of 0.070%).
| Demographics | Rating | Rank | 11th Grade |
| Afghans | 12.8 /100 | #214 | Poor 92.1% |
| Immigrants | Southern Europe | 12.5 /100 | #215 | Poor 92.1% |
| Somalis | 11.6 /100 | #216 | Poor 92.1% |
| Immigrants | Sierra Leone | 11.1 /100 | #217 | Poor 92.0% |
| Blackfeet | 10.1 /100 | #218 | Poor 92.0% |
| Portuguese | 10.0 /100 | #219 | Tragic 92.0% |
| South American Indians | 7.6 /100 | #220 | Tragic 92.0% |
| Immigrants | Liberia | 7.0 /100 | #221 | Tragic 91.9% |
| Immigrants | Africa | 6.5 /100 | #222 | Tragic 91.9% |
| Immigrants | Bahamas | 6.5 /100 | #223 | Tragic 91.9% |
| Costa Ricans | 6.3 /100 | #224 | Tragic 91.9% |
| Immigrants | Zaire | 5.4 /100 | #225 | Tragic 91.9% |
| Immigrants | Somalia | 5.2 /100 | #226 | Tragic 91.9% |
| Immigrants | Cameroon | 4.4 /100 | #227 | Tragic 91.8% |
| Immigrants | Panama | 4.3 /100 | #228 | Tragic 91.8% |