Portuguese vs Tongan 6th Grade
COMPARE
Portuguese
Tongan
6th Grade
6th Grade Comparison
Portuguese
Tongans
96.8%
6TH GRADE
8.2/ 100
METRIC RATING
214th/ 347
METRIC RANK
96.7%
6TH GRADE
6.1/ 100
METRIC RATING
221st/ 347
METRIC RANK
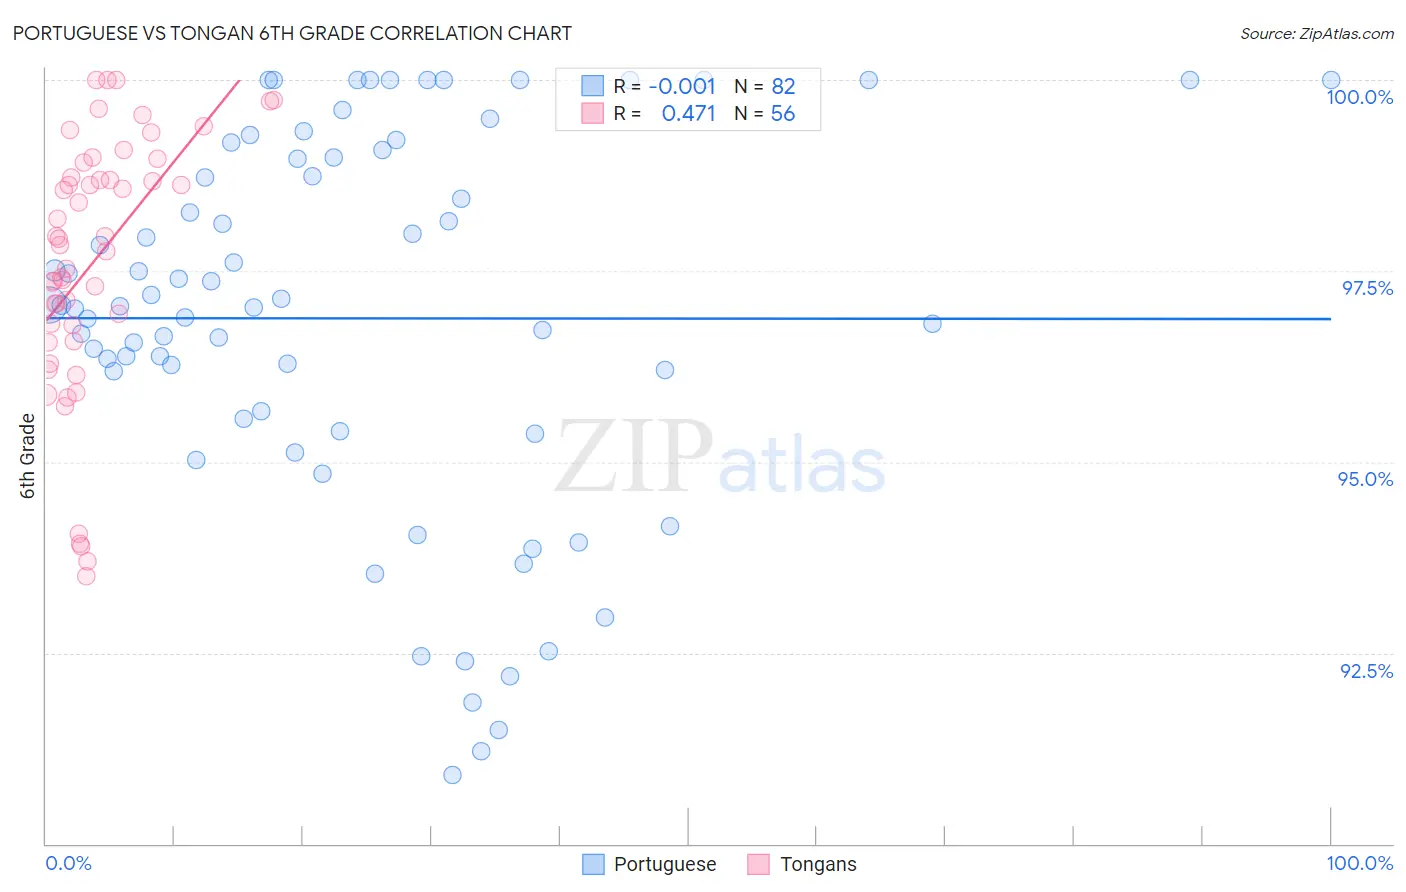
Portuguese vs Tongan 6th Grade Correlation Chart
The statistical analysis conducted on geographies consisting of 450,351,764 people shows no correlation between the proportion of Portuguese and percentage of population with at least 6th grade education in the United States with a correlation coefficient (R) of -0.001 and weighted average of 96.8%. Similarly, the statistical analysis conducted on geographies consisting of 102,873,790 people shows a moderate positive correlation between the proportion of Tongans and percentage of population with at least 6th grade education in the United States with a correlation coefficient (R) of 0.471 and weighted average of 96.7%, a difference of 0.040%.
6th Grade Correlation Summary
| Measurement | Portuguese | Tongan |
| Minimum | 90.9% | 93.5% |
| Maximum | 100.0% | 100.0% |
| Range | 9.1% | 6.5% |
| Mean | 96.9% | 97.6% |
| Median | 97.0% | 97.9% |
| Interquartile 25% (IQ1) | 95.6% | 96.7% |
| Interquartile 75% (IQ3) | 99.0% | 98.8% |
| Interquartile Range (IQR) | 3.4% | 2.1% |
| Standard Deviation (Sample) | 2.5% | 1.7% |
| Standard Deviation (Population) | 2.4% | 1.7% |
Demographics Similar to Portuguese and Tongans by 6th Grade
In terms of 6th grade, the demographic groups most similar to Portuguese are Sierra Leonean (96.8%, a difference of 0.0%), Immigrants from Iraq (96.8%, a difference of 0.010%), Moroccan (96.8%, a difference of 0.010%), Immigrants from Sudan (96.8%, a difference of 0.010%), and Paiute (96.8%, a difference of 0.010%). Similarly, the demographic groups most similar to Tongans are Immigrants from Morocco (96.7%, a difference of 0.0%), Immigrants from Syria (96.7%, a difference of 0.0%), Costa Rican (96.8%, a difference of 0.010%), Liberian (96.8%, a difference of 0.020%), and Navajo (96.8%, a difference of 0.020%).
| Demographics | Rating | Rank | 6th Grade |
| Iraqis | 11.7 /100 | #207 | Poor 96.8% |
| Samoans | 11.0 /100 | #208 | Poor 96.8% |
| Immigrants | Oceania | 11.0 /100 | #209 | Poor 96.8% |
| Immigrants | Nepal | 10.1 /100 | #210 | Poor 96.8% |
| Immigrants | Iraq | 9.2 /100 | #211 | Tragic 96.8% |
| Moroccans | 9.0 /100 | #212 | Tragic 96.8% |
| Immigrants | Sudan | 8.7 /100 | #213 | Tragic 96.8% |
| Portuguese | 8.2 /100 | #214 | Tragic 96.8% |
| Sierra Leoneans | 8.0 /100 | #215 | Tragic 96.8% |
| Paiute | 7.8 /100 | #216 | Tragic 96.8% |
| Liberians | 7.5 /100 | #217 | Tragic 96.8% |
| Navajo | 7.3 /100 | #218 | Tragic 96.8% |
| Costa Ricans | 6.8 /100 | #219 | Tragic 96.8% |
| Immigrants | Morocco | 6.2 /100 | #220 | Tragic 96.7% |
| Tongans | 6.1 /100 | #221 | Tragic 96.7% |
| Immigrants | Syria | 5.9 /100 | #222 | Tragic 96.7% |
| Bahamians | 4.8 /100 | #223 | Tragic 96.7% |
| Immigrants | Southern Europe | 4.4 /100 | #224 | Tragic 96.7% |
| Immigrants | Pakistan | 4.4 /100 | #225 | Tragic 96.7% |
| Immigrants | Panama | 4.2 /100 | #226 | Tragic 96.7% |
| Immigrants | Western Asia | 4.1 /100 | #227 | Tragic 96.7% |