Inupiat vs Tongan 6th Grade
COMPARE
Inupiat
Tongan
6th Grade
6th Grade Comparison
Inupiat
Tongans
98.1%
6TH GRADE
100.0/ 100
METRIC RATING
15th/ 347
METRIC RANK
96.7%
6TH GRADE
6.1/ 100
METRIC RATING
221st/ 347
METRIC RANK
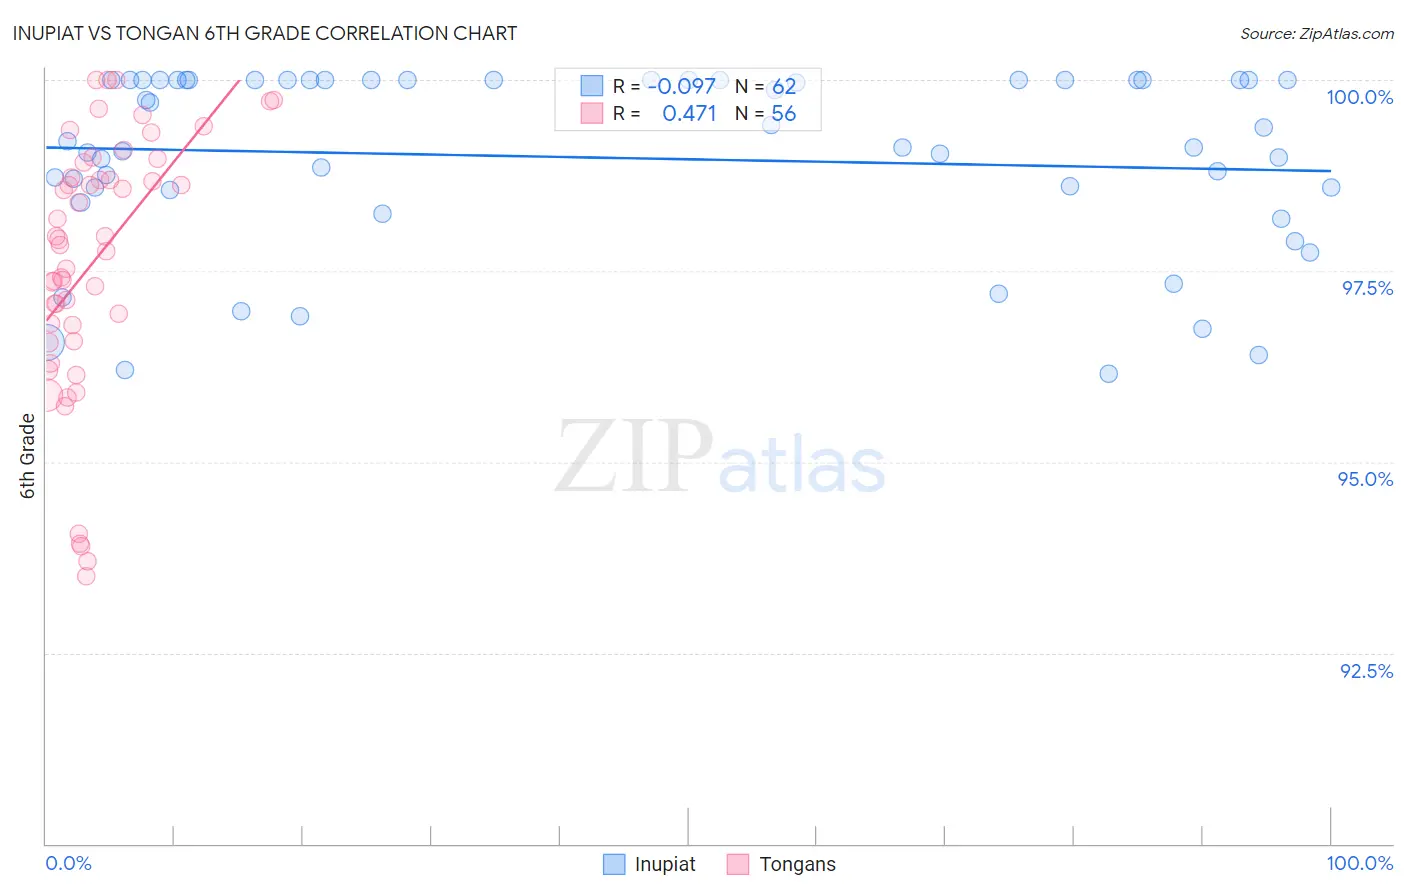
Inupiat vs Tongan 6th Grade Correlation Chart
The statistical analysis conducted on geographies consisting of 96,348,974 people shows a slight negative correlation between the proportion of Inupiat and percentage of population with at least 6th grade education in the United States with a correlation coefficient (R) of -0.097 and weighted average of 98.1%. Similarly, the statistical analysis conducted on geographies consisting of 102,873,790 people shows a moderate positive correlation between the proportion of Tongans and percentage of population with at least 6th grade education in the United States with a correlation coefficient (R) of 0.471 and weighted average of 96.7%, a difference of 1.4%.
6th Grade Correlation Summary
| Measurement | Inupiat | Tongan |
| Minimum | 96.2% | 93.5% |
| Maximum | 100.0% | 100.0% |
| Range | 3.8% | 6.5% |
| Mean | 99.0% | 97.6% |
| Median | 99.2% | 97.9% |
| Interquartile 25% (IQ1) | 98.6% | 96.7% |
| Interquartile 75% (IQ3) | 100.0% | 98.8% |
| Interquartile Range (IQR) | 1.4% | 2.1% |
| Standard Deviation (Sample) | 1.2% | 1.7% |
| Standard Deviation (Population) | 1.2% | 1.7% |
Similar Demographics by 6th Grade
Demographics Similar to Inupiat by 6th Grade
In terms of 6th grade, the demographic groups most similar to Inupiat are Carpatho Rusyn (98.1%, a difference of 0.010%), Scottish (98.1%, a difference of 0.010%), Tlingit-Haida (98.1%, a difference of 0.020%), Polish (98.1%, a difference of 0.020%), and Pennsylvania German (98.1%, a difference of 0.020%).
| Demographics | Rating | Rank | 6th Grade |
| Slovaks | 100.0 /100 | #8 | Exceptional 98.2% |
| Slovenes | 100.0 /100 | #9 | Exceptional 98.2% |
| Swedes | 100.0 /100 | #10 | Exceptional 98.2% |
| English | 100.0 /100 | #11 | Exceptional 98.1% |
| Alaskan Athabascans | 100.0 /100 | #12 | Exceptional 98.1% |
| Tlingit-Haida | 100.0 /100 | #13 | Exceptional 98.1% |
| Carpatho Rusyns | 100.0 /100 | #14 | Exceptional 98.1% |
| Inupiat | 100.0 /100 | #15 | Exceptional 98.1% |
| Scottish | 100.0 /100 | #16 | Exceptional 98.1% |
| Poles | 100.0 /100 | #17 | Exceptional 98.1% |
| Pennsylvania Germans | 100.0 /100 | #18 | Exceptional 98.1% |
| Irish | 100.0 /100 | #19 | Exceptional 98.1% |
| Finns | 100.0 /100 | #20 | Exceptional 98.1% |
| Lithuanians | 100.0 /100 | #21 | Exceptional 98.1% |
| Danes | 100.0 /100 | #22 | Exceptional 98.0% |
Demographics Similar to Tongans by 6th Grade
In terms of 6th grade, the demographic groups most similar to Tongans are Immigrants from Morocco (96.7%, a difference of 0.0%), Immigrants from Syria (96.7%, a difference of 0.0%), Costa Rican (96.8%, a difference of 0.010%), Liberian (96.8%, a difference of 0.020%), and Navajo (96.8%, a difference of 0.020%).
| Demographics | Rating | Rank | 6th Grade |
| Portuguese | 8.2 /100 | #214 | Tragic 96.8% |
| Sierra Leoneans | 8.0 /100 | #215 | Tragic 96.8% |
| Paiute | 7.8 /100 | #216 | Tragic 96.8% |
| Liberians | 7.5 /100 | #217 | Tragic 96.8% |
| Navajo | 7.3 /100 | #218 | Tragic 96.8% |
| Costa Ricans | 6.8 /100 | #219 | Tragic 96.8% |
| Immigrants | Morocco | 6.2 /100 | #220 | Tragic 96.7% |
| Tongans | 6.1 /100 | #221 | Tragic 96.7% |
| Immigrants | Syria | 5.9 /100 | #222 | Tragic 96.7% |
| Bahamians | 4.8 /100 | #223 | Tragic 96.7% |
| Immigrants | Southern Europe | 4.4 /100 | #224 | Tragic 96.7% |
| Immigrants | Pakistan | 4.4 /100 | #225 | Tragic 96.7% |
| Immigrants | Panama | 4.2 /100 | #226 | Tragic 96.7% |
| Immigrants | Western Asia | 4.1 /100 | #227 | Tragic 96.7% |
| Immigrants | Malaysia | 4.0 /100 | #228 | Tragic 96.7% |