Pennsylvania German vs Immigrants from Malaysia Bachelor's Degree
COMPARE
Pennsylvania German
Immigrants from Malaysia
Bachelor's Degree
Bachelor's Degree Comparison
Pennsylvania Germans
Immigrants from Malaysia
28.4%
BACHELOR'S DEGREE
0.0/ 100
METRIC RATING
325th/ 347
METRIC RANK
45.0%
BACHELOR'S DEGREE
100.0/ 100
METRIC RATING
41st/ 347
METRIC RANK
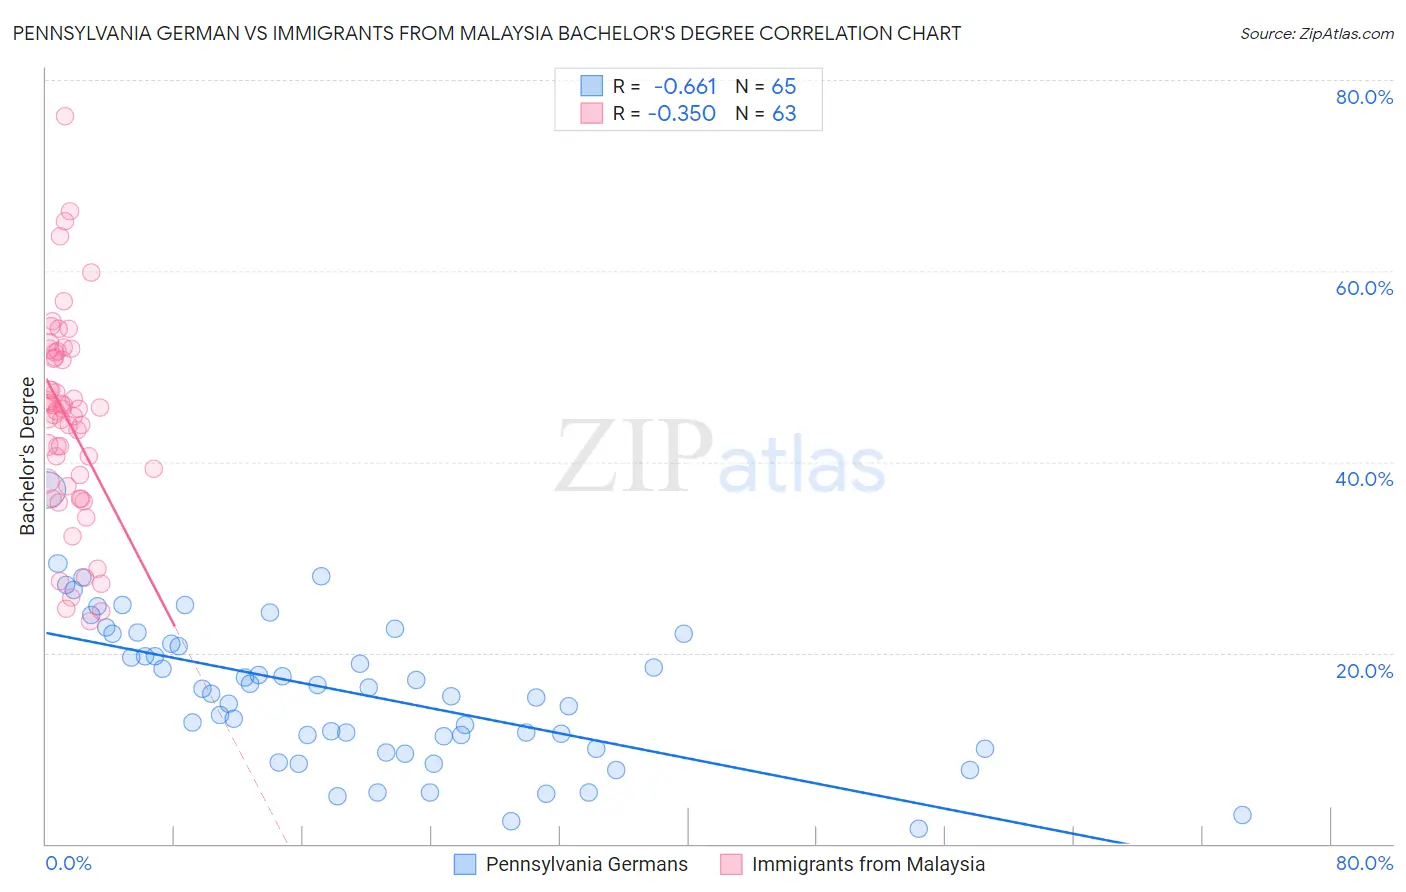
Pennsylvania German vs Immigrants from Malaysia Bachelor's Degree Correlation Chart
The statistical analysis conducted on geographies consisting of 234,090,370 people shows a significant negative correlation between the proportion of Pennsylvania Germans and percentage of population with at least bachelor's degree education in the United States with a correlation coefficient (R) of -0.661 and weighted average of 28.4%. Similarly, the statistical analysis conducted on geographies consisting of 197,964,670 people shows a mild negative correlation between the proportion of Immigrants from Malaysia and percentage of population with at least bachelor's degree education in the United States with a correlation coefficient (R) of -0.350 and weighted average of 45.0%, a difference of 58.6%.
Bachelor's Degree Correlation Summary
| Measurement | Pennsylvania German | Immigrants from Malaysia |
| Minimum | 1.6% | 23.2% |
| Maximum | 37.0% | 76.2% |
| Range | 35.5% | 53.0% |
| Mean | 15.7% | 44.4% |
| Median | 15.7% | 45.3% |
| Interquartile 25% (IQ1) | 10.0% | 37.4% |
| Interquartile 75% (IQ3) | 21.4% | 51.4% |
| Interquartile Range (IQR) | 11.4% | 14.1% |
| Standard Deviation (Sample) | 7.5% | 10.7% |
| Standard Deviation (Population) | 7.4% | 10.6% |
Similar Demographics by Bachelor's Degree
Demographics Similar to Pennsylvania Germans by Bachelor's Degree
In terms of bachelor's degree, the demographic groups most similar to Pennsylvania Germans are Apache (28.3%, a difference of 0.39%), Dutch West Indian (28.5%, a difference of 0.45%), Paiute (28.1%, a difference of 1.1%), Fijian (28.7%, a difference of 1.2%), and Tsimshian (28.8%, a difference of 1.3%).
| Demographics | Rating | Rank | Bachelor's Degree |
| Yaqui | 0.0 /100 | #318 | Tragic 29.0% |
| Creek | 0.0 /100 | #319 | Tragic 28.9% |
| Kiowa | 0.0 /100 | #320 | Tragic 28.8% |
| Alaskan Athabascans | 0.0 /100 | #321 | Tragic 28.8% |
| Tsimshian | 0.0 /100 | #322 | Tragic 28.8% |
| Fijians | 0.0 /100 | #323 | Tragic 28.7% |
| Dutch West Indians | 0.0 /100 | #324 | Tragic 28.5% |
| Pennsylvania Germans | 0.0 /100 | #325 | Tragic 28.4% |
| Apache | 0.0 /100 | #326 | Tragic 28.3% |
| Paiute | 0.0 /100 | #327 | Tragic 28.1% |
| Crow | 0.0 /100 | #328 | Tragic 27.7% |
| Immigrants | Central America | 0.0 /100 | #329 | Tragic 27.5% |
| Spanish American Indians | 0.0 /100 | #330 | Tragic 27.5% |
| Immigrants | Azores | 0.0 /100 | #331 | Tragic 27.3% |
| Menominee | 0.0 /100 | #332 | Tragic 27.3% |
Demographics Similar to Immigrants from Malaysia by Bachelor's Degree
In terms of bachelor's degree, the demographic groups most similar to Immigrants from Malaysia are Immigrants from Belarus (45.0%, a difference of 0.040%), Immigrants from Latvia (45.1%, a difference of 0.31%), Immigrants from Saudi Arabia (44.8%, a difference of 0.38%), Immigrants from South Africa (44.8%, a difference of 0.52%), and Bulgarian (45.3%, a difference of 0.64%).
| Demographics | Rating | Rank | Bachelor's Degree |
| Immigrants | Denmark | 100.0 /100 | #34 | Exceptional 45.4% |
| Immigrants | Russia | 100.0 /100 | #35 | Exceptional 45.4% |
| Mongolians | 100.0 /100 | #36 | Exceptional 45.4% |
| Russians | 100.0 /100 | #37 | Exceptional 45.3% |
| Bulgarians | 100.0 /100 | #38 | Exceptional 45.3% |
| Immigrants | Latvia | 100.0 /100 | #39 | Exceptional 45.1% |
| Immigrants | Belarus | 100.0 /100 | #40 | Exceptional 45.0% |
| Immigrants | Malaysia | 100.0 /100 | #41 | Exceptional 45.0% |
| Immigrants | Saudi Arabia | 100.0 /100 | #42 | Exceptional 44.8% |
| Immigrants | South Africa | 99.9 /100 | #43 | Exceptional 44.8% |
| Immigrants | Lithuania | 99.9 /100 | #44 | Exceptional 44.6% |
| Immigrants | Kuwait | 99.9 /100 | #45 | Exceptional 44.6% |
| Immigrants | Bulgaria | 99.9 /100 | #46 | Exceptional 44.6% |
| Bolivians | 99.9 /100 | #47 | Exceptional 44.6% |
| Estonians | 99.9 /100 | #48 | Exceptional 44.6% |