Pennsylvania German vs Immigrants from Guatemala Bachelor's Degree
COMPARE
Pennsylvania German
Immigrants from Guatemala
Bachelor's Degree
Bachelor's Degree Comparison
Pennsylvania Germans
Immigrants from Guatemala
28.4%
BACHELOR'S DEGREE
0.0/ 100
METRIC RATING
325th/ 347
METRIC RANK
30.8%
BACHELOR'S DEGREE
0.0/ 100
METRIC RATING
294th/ 347
METRIC RANK
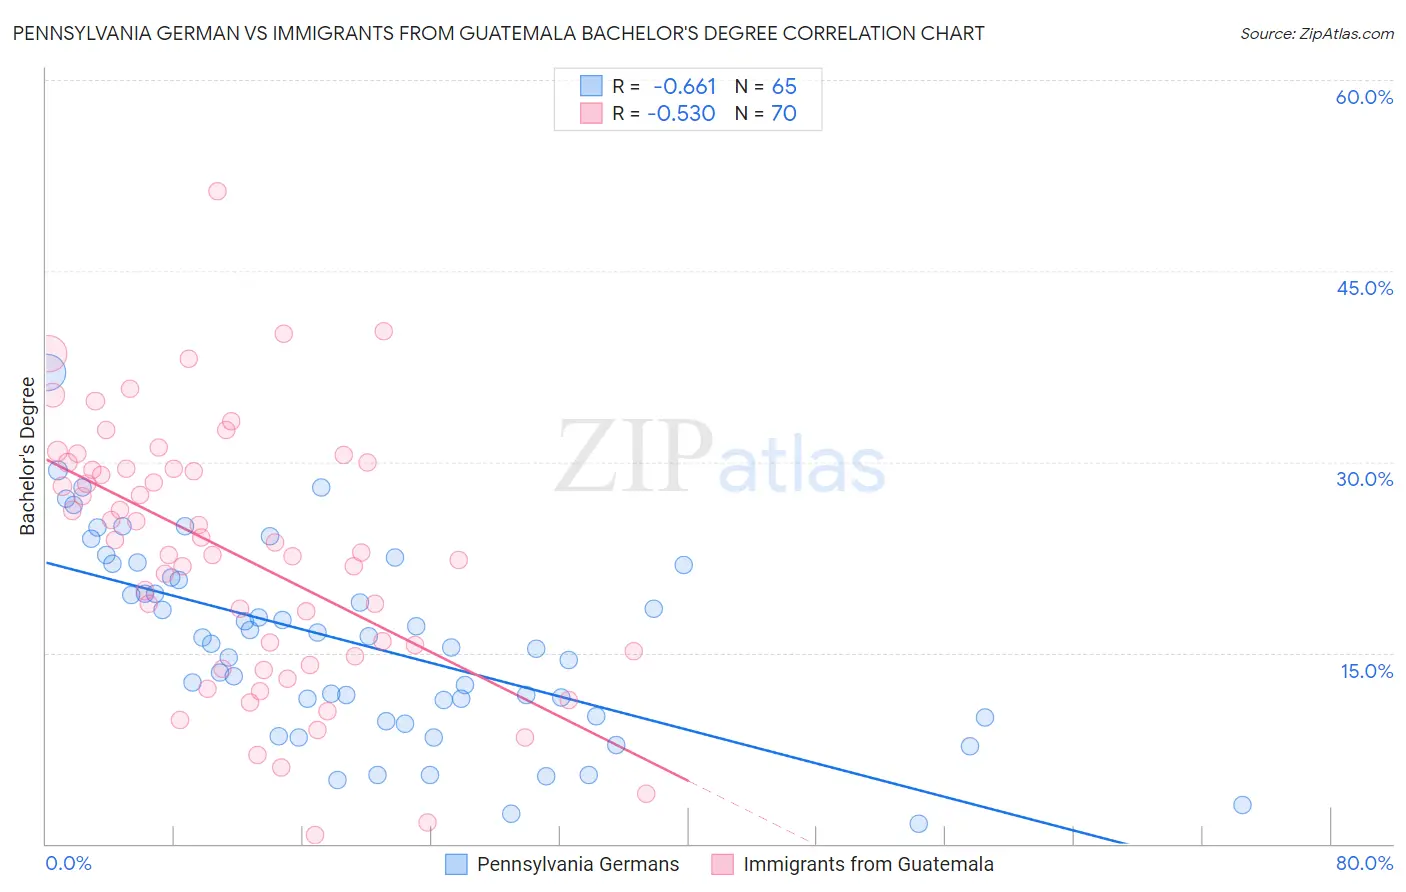
Pennsylvania German vs Immigrants from Guatemala Bachelor's Degree Correlation Chart
The statistical analysis conducted on geographies consisting of 234,090,370 people shows a significant negative correlation between the proportion of Pennsylvania Germans and percentage of population with at least bachelor's degree education in the United States with a correlation coefficient (R) of -0.661 and weighted average of 28.4%. Similarly, the statistical analysis conducted on geographies consisting of 377,260,435 people shows a substantial negative correlation between the proportion of Immigrants from Guatemala and percentage of population with at least bachelor's degree education in the United States with a correlation coefficient (R) of -0.530 and weighted average of 30.8%, a difference of 8.3%.
Bachelor's Degree Correlation Summary
| Measurement | Pennsylvania German | Immigrants from Guatemala |
| Minimum | 1.6% | 0.73% |
| Maximum | 37.0% | 51.3% |
| Range | 35.5% | 50.6% |
| Mean | 15.7% | 22.7% |
| Median | 15.7% | 23.3% |
| Interquartile 25% (IQ1) | 10.0% | 14.7% |
| Interquartile 75% (IQ3) | 21.4% | 29.5% |
| Interquartile Range (IQR) | 11.4% | 14.7% |
| Standard Deviation (Sample) | 7.5% | 10.2% |
| Standard Deviation (Population) | 7.4% | 10.1% |
Similar Demographics by Bachelor's Degree
Demographics Similar to Pennsylvania Germans by Bachelor's Degree
In terms of bachelor's degree, the demographic groups most similar to Pennsylvania Germans are Apache (28.3%, a difference of 0.39%), Dutch West Indian (28.5%, a difference of 0.45%), Paiute (28.1%, a difference of 1.1%), Fijian (28.7%, a difference of 1.2%), and Tsimshian (28.8%, a difference of 1.3%).
| Demographics | Rating | Rank | Bachelor's Degree |
| Yaqui | 0.0 /100 | #318 | Tragic 29.0% |
| Creek | 0.0 /100 | #319 | Tragic 28.9% |
| Kiowa | 0.0 /100 | #320 | Tragic 28.8% |
| Alaskan Athabascans | 0.0 /100 | #321 | Tragic 28.8% |
| Tsimshian | 0.0 /100 | #322 | Tragic 28.8% |
| Fijians | 0.0 /100 | #323 | Tragic 28.7% |
| Dutch West Indians | 0.0 /100 | #324 | Tragic 28.5% |
| Pennsylvania Germans | 0.0 /100 | #325 | Tragic 28.4% |
| Apache | 0.0 /100 | #326 | Tragic 28.3% |
| Paiute | 0.0 /100 | #327 | Tragic 28.1% |
| Crow | 0.0 /100 | #328 | Tragic 27.7% |
| Immigrants | Central America | 0.0 /100 | #329 | Tragic 27.5% |
| Spanish American Indians | 0.0 /100 | #330 | Tragic 27.5% |
| Immigrants | Azores | 0.0 /100 | #331 | Tragic 27.3% |
| Menominee | 0.0 /100 | #332 | Tragic 27.3% |
Demographics Similar to Immigrants from Guatemala by Bachelor's Degree
In terms of bachelor's degree, the demographic groups most similar to Immigrants from Guatemala are Immigrants from Dominican Republic (30.7%, a difference of 0.24%), Puget Sound Salish (30.7%, a difference of 0.34%), Cape Verdean (30.9%, a difference of 0.40%), Immigrants from Haiti (30.6%, a difference of 0.40%), and Ute (30.9%, a difference of 0.49%).
| Demographics | Rating | Rank | Bachelor's Degree |
| Ottawa | 0.1 /100 | #287 | Tragic 31.1% |
| Guatemalans | 0.1 /100 | #288 | Tragic 31.0% |
| Puerto Ricans | 0.1 /100 | #289 | Tragic 31.0% |
| Immigrants | Honduras | 0.1 /100 | #290 | Tragic 30.9% |
| Blacks/African Americans | 0.1 /100 | #291 | Tragic 30.9% |
| Ute | 0.1 /100 | #292 | Tragic 30.9% |
| Cape Verdeans | 0.1 /100 | #293 | Tragic 30.9% |
| Immigrants | Guatemala | 0.0 /100 | #294 | Tragic 30.8% |
| Immigrants | Dominican Republic | 0.0 /100 | #295 | Tragic 30.7% |
| Puget Sound Salish | 0.0 /100 | #296 | Tragic 30.7% |
| Immigrants | Haiti | 0.0 /100 | #297 | Tragic 30.6% |
| Chippewa | 0.0 /100 | #298 | Tragic 30.6% |
| Chickasaw | 0.0 /100 | #299 | Tragic 30.4% |
| Immigrants | Micronesia | 0.0 /100 | #300 | Tragic 30.4% |
| Immigrants | Cuba | 0.0 /100 | #301 | Tragic 30.3% |