Ottawa vs Peruvian High School Diploma
COMPARE
Ottawa
Peruvian
High School Diploma
High School Diploma Comparison
Ottawa
Peruvians
90.1%
HIGH SCHOOL DIPLOMA
94.4/ 100
METRIC RATING
120th/ 347
METRIC RANK
87.8%
HIGH SCHOOL DIPLOMA
1.9/ 100
METRIC RATING
245th/ 347
METRIC RANK
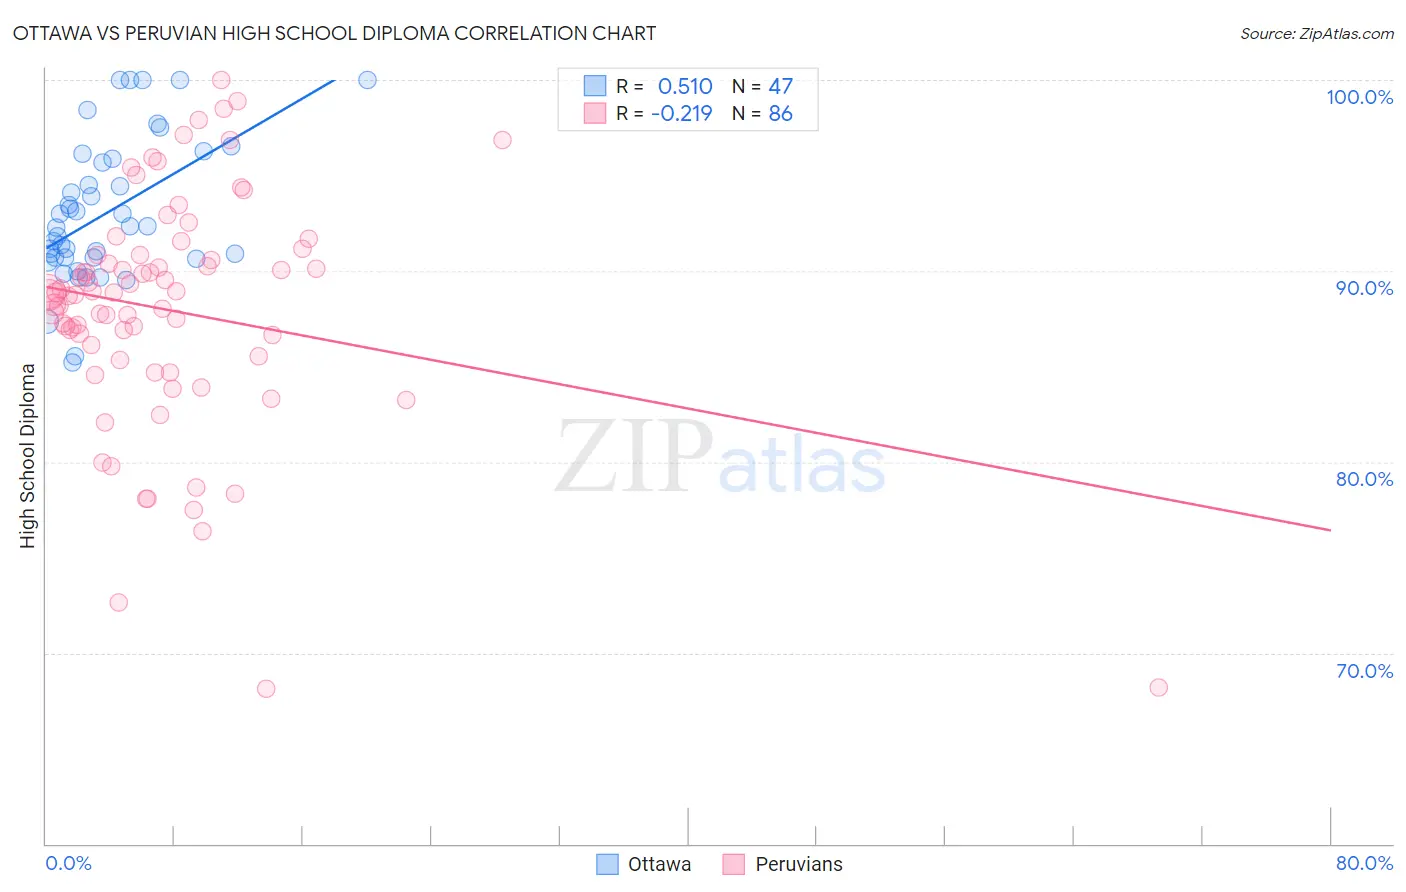
Ottawa vs Peruvian High School Diploma Correlation Chart
The statistical analysis conducted on geographies consisting of 49,956,602 people shows a substantial positive correlation between the proportion of Ottawa and percentage of population with at least high school diploma education in the United States with a correlation coefficient (R) of 0.510 and weighted average of 90.1%. Similarly, the statistical analysis conducted on geographies consisting of 363,251,075 people shows a weak negative correlation between the proportion of Peruvians and percentage of population with at least high school diploma education in the United States with a correlation coefficient (R) of -0.219 and weighted average of 87.8%, a difference of 2.6%.
High School Diploma Correlation Summary
| Measurement | Ottawa | Peruvian |
| Minimum | 85.2% | 68.1% |
| Maximum | 100.0% | 100.0% |
| Range | 14.8% | 31.9% |
| Mean | 93.1% | 87.9% |
| Median | 92.4% | 88.8% |
| Interquartile 25% (IQ1) | 90.7% | 85.5% |
| Interquartile 75% (IQ3) | 95.9% | 90.8% |
| Interquartile Range (IQR) | 5.2% | 5.3% |
| Standard Deviation (Sample) | 3.7% | 6.1% |
| Standard Deviation (Population) | 3.7% | 6.1% |
Similar Demographics by High School Diploma
Demographics Similar to Ottawa by High School Diploma
In terms of high school diploma, the demographic groups most similar to Ottawa are White/Caucasian (90.1%, a difference of 0.020%), Immigrants from Eastern Europe (90.1%, a difference of 0.030%), Israeli (90.1%, a difference of 0.050%), Jordanian (90.2%, a difference of 0.070%), and Immigrants from Kazakhstan (90.0%, a difference of 0.070%).
| Demographics | Rating | Rank | High School Diploma |
| Immigrants | Sri Lanka | 96.3 /100 | #113 | Exceptional 90.2% |
| Yugoslavians | 96.2 /100 | #114 | Exceptional 90.2% |
| Immigrants | Hungary | 95.8 /100 | #115 | Exceptional 90.2% |
| Immigrants | Germany | 95.7 /100 | #116 | Exceptional 90.2% |
| Jordanians | 95.4 /100 | #117 | Exceptional 90.2% |
| Israelis | 95.1 /100 | #118 | Exceptional 90.1% |
| Immigrants | Eastern Europe | 94.9 /100 | #119 | Exceptional 90.1% |
| Ottawa | 94.4 /100 | #120 | Exceptional 90.1% |
| Whites/Caucasians | 94.1 /100 | #121 | Exceptional 90.1% |
| Immigrants | Kazakhstan | 93.4 /100 | #122 | Exceptional 90.0% |
| German Russians | 92.0 /100 | #123 | Exceptional 90.0% |
| Mongolians | 91.6 /100 | #124 | Exceptional 89.9% |
| Egyptians | 91.1 /100 | #125 | Exceptional 89.9% |
| Alaska Natives | 91.0 /100 | #126 | Exceptional 89.9% |
| Immigrants | Eastern Asia | 89.2 /100 | #127 | Excellent 89.9% |
Demographics Similar to Peruvians by High School Diploma
In terms of high school diploma, the demographic groups most similar to Peruvians are Immigrants from Philippines (87.8%, a difference of 0.010%), Choctaw (87.8%, a difference of 0.010%), Immigrants from Eritrea (87.8%, a difference of 0.030%), Immigrants from Uzbekistan (87.8%, a difference of 0.040%), and Cheyenne (87.8%, a difference of 0.040%).
| Demographics | Rating | Rank | High School Diploma |
| Sioux | 2.7 /100 | #238 | Tragic 87.9% |
| South Americans | 2.7 /100 | #239 | Tragic 87.9% |
| Comanche | 2.2 /100 | #240 | Tragic 87.9% |
| Immigrants | Uzbekistan | 2.1 /100 | #241 | Tragic 87.8% |
| Cheyenne | 2.1 /100 | #242 | Tragic 87.8% |
| Immigrants | Philippines | 1.9 /100 | #243 | Tragic 87.8% |
| Choctaw | 1.9 /100 | #244 | Tragic 87.8% |
| Peruvians | 1.9 /100 | #245 | Tragic 87.8% |
| Immigrants | Eritrea | 1.7 /100 | #246 | Tragic 87.8% |
| Immigrants | Costa Rica | 1.7 /100 | #247 | Tragic 87.8% |
| Spanish Americans | 1.5 /100 | #248 | Tragic 87.7% |
| Senegalese | 1.5 /100 | #249 | Tragic 87.7% |
| Immigrants | Nigeria | 1.5 /100 | #250 | Tragic 87.7% |
| Ghanaians | 1.4 /100 | #251 | Tragic 87.7% |
| Immigrants | South America | 1.2 /100 | #252 | Tragic 87.6% |