Ottawa vs Immigrants from Saudi Arabia High School Diploma
COMPARE
Ottawa
Immigrants from Saudi Arabia
High School Diploma
High School Diploma Comparison
Ottawa
Immigrants from Saudi Arabia
90.1%
HIGH SCHOOL DIPLOMA
94.4/ 100
METRIC RATING
120th/ 347
METRIC RANK
90.7%
HIGH SCHOOL DIPLOMA
99.1/ 100
METRIC RATING
84th/ 347
METRIC RANK
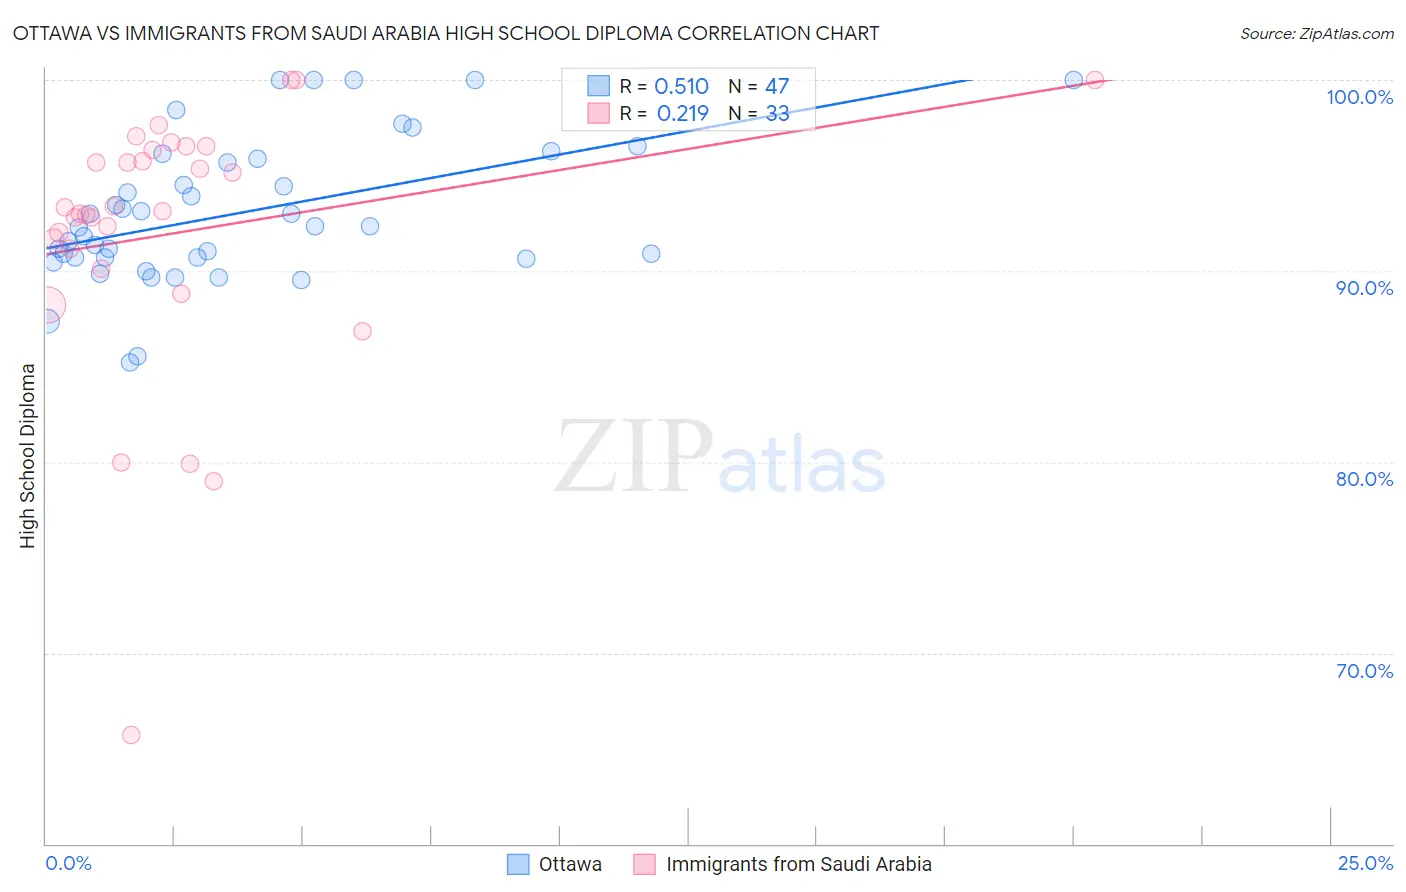
Ottawa vs Immigrants from Saudi Arabia High School Diploma Correlation Chart
The statistical analysis conducted on geographies consisting of 49,956,602 people shows a substantial positive correlation between the proportion of Ottawa and percentage of population with at least high school diploma education in the United States with a correlation coefficient (R) of 0.510 and weighted average of 90.1%. Similarly, the statistical analysis conducted on geographies consisting of 164,289,382 people shows a weak positive correlation between the proportion of Immigrants from Saudi Arabia and percentage of population with at least high school diploma education in the United States with a correlation coefficient (R) of 0.219 and weighted average of 90.7%, a difference of 0.69%.
High School Diploma Correlation Summary
| Measurement | Ottawa | Immigrants from Saudi Arabia |
| Minimum | 85.2% | 65.7% |
| Maximum | 100.0% | 100.0% |
| Range | 14.8% | 34.3% |
| Mean | 93.1% | 92.0% |
| Median | 92.4% | 93.1% |
| Interquartile 25% (IQ1) | 90.7% | 90.7% |
| Interquartile 75% (IQ3) | 95.9% | 96.4% |
| Interquartile Range (IQR) | 5.2% | 5.8% |
| Standard Deviation (Sample) | 3.7% | 7.1% |
| Standard Deviation (Population) | 3.7% | 7.0% |
Similar Demographics by High School Diploma
Demographics Similar to Ottawa by High School Diploma
In terms of high school diploma, the demographic groups most similar to Ottawa are White/Caucasian (90.1%, a difference of 0.020%), Immigrants from Eastern Europe (90.1%, a difference of 0.030%), Israeli (90.1%, a difference of 0.050%), Jordanian (90.2%, a difference of 0.070%), and Immigrants from Kazakhstan (90.0%, a difference of 0.070%).
| Demographics | Rating | Rank | High School Diploma |
| Immigrants | Sri Lanka | 96.3 /100 | #113 | Exceptional 90.2% |
| Yugoslavians | 96.2 /100 | #114 | Exceptional 90.2% |
| Immigrants | Hungary | 95.8 /100 | #115 | Exceptional 90.2% |
| Immigrants | Germany | 95.7 /100 | #116 | Exceptional 90.2% |
| Jordanians | 95.4 /100 | #117 | Exceptional 90.2% |
| Israelis | 95.1 /100 | #118 | Exceptional 90.1% |
| Immigrants | Eastern Europe | 94.9 /100 | #119 | Exceptional 90.1% |
| Ottawa | 94.4 /100 | #120 | Exceptional 90.1% |
| Whites/Caucasians | 94.1 /100 | #121 | Exceptional 90.1% |
| Immigrants | Kazakhstan | 93.4 /100 | #122 | Exceptional 90.0% |
| German Russians | 92.0 /100 | #123 | Exceptional 90.0% |
| Mongolians | 91.6 /100 | #124 | Exceptional 89.9% |
| Egyptians | 91.1 /100 | #125 | Exceptional 89.9% |
| Alaska Natives | 91.0 /100 | #126 | Exceptional 89.9% |
| Immigrants | Eastern Asia | 89.2 /100 | #127 | Excellent 89.9% |
Demographics Similar to Immigrants from Saudi Arabia by High School Diploma
In terms of high school diploma, the demographic groups most similar to Immigrants from Saudi Arabia are Immigrants from Moldova (90.7%, a difference of 0.030%), Scotch-Irish (90.8%, a difference of 0.050%), Romanian (90.7%, a difference of 0.070%), Immigrants from Bulgaria (90.6%, a difference of 0.080%), and Immigrants from England (90.8%, a difference of 0.090%).
| Demographics | Rating | Rank | High School Diploma |
| Native Hawaiians | 99.3 /100 | #77 | Exceptional 90.8% |
| Burmese | 99.3 /100 | #78 | Exceptional 90.8% |
| Immigrants | Denmark | 99.3 /100 | #79 | Exceptional 90.8% |
| Immigrants | England | 99.3 /100 | #80 | Exceptional 90.8% |
| Immigrants | Switzerland | 99.3 /100 | #81 | Exceptional 90.8% |
| Scotch-Irish | 99.2 /100 | #82 | Exceptional 90.8% |
| Immigrants | Moldova | 99.2 /100 | #83 | Exceptional 90.7% |
| Immigrants | Saudi Arabia | 99.1 /100 | #84 | Exceptional 90.7% |
| Romanians | 98.9 /100 | #85 | Exceptional 90.7% |
| Immigrants | Bulgaria | 98.9 /100 | #86 | Exceptional 90.6% |
| Immigrants | Turkey | 98.9 /100 | #87 | Exceptional 90.6% |
| Immigrants | France | 98.8 /100 | #88 | Exceptional 90.6% |
| Canadians | 98.7 /100 | #89 | Exceptional 90.6% |
| Celtics | 98.7 /100 | #90 | Exceptional 90.6% |
| South Africans | 98.6 /100 | #91 | Exceptional 90.6% |