Ottawa vs Immigrants from Chile Doctorate Degree
COMPARE
Ottawa
Immigrants from Chile
Doctorate Degree
Doctorate Degree Comparison
Ottawa
Immigrants from Chile
1.6%
DOCTORATE DEGREE
2.2/ 100
METRIC RATING
242nd/ 347
METRIC RANK
2.1%
DOCTORATE DEGREE
98.1/ 100
METRIC RATING
102nd/ 347
METRIC RANK
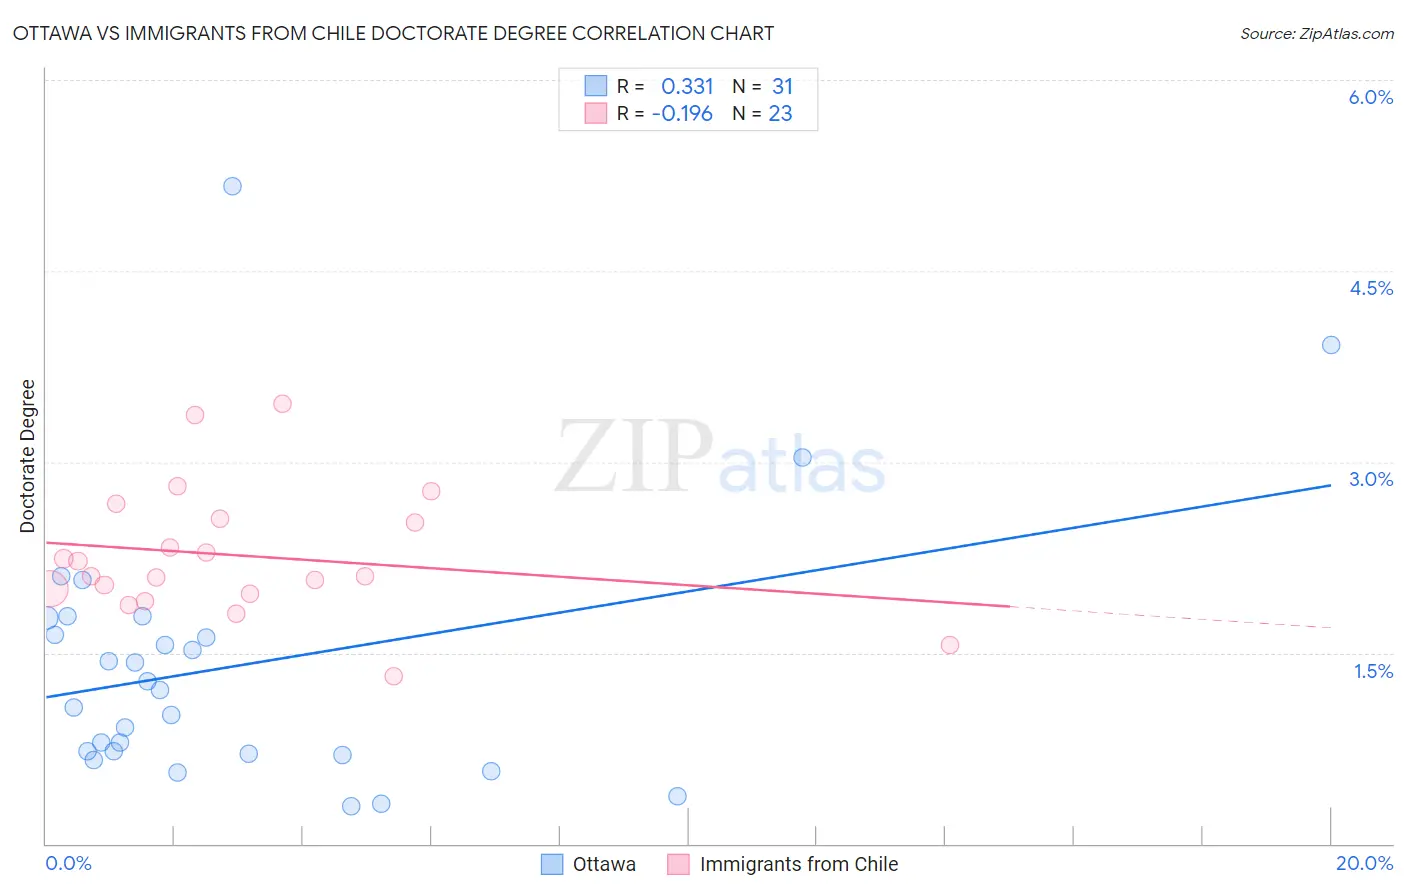
Ottawa vs Immigrants from Chile Doctorate Degree Correlation Chart
The statistical analysis conducted on geographies consisting of 49,607,860 people shows a mild positive correlation between the proportion of Ottawa and percentage of population with at least doctorate degree education in the United States with a correlation coefficient (R) of 0.331 and weighted average of 1.6%. Similarly, the statistical analysis conducted on geographies consisting of 217,998,165 people shows a poor negative correlation between the proportion of Immigrants from Chile and percentage of population with at least doctorate degree education in the United States with a correlation coefficient (R) of -0.196 and weighted average of 2.1%, a difference of 33.0%.
Doctorate Degree Correlation Summary
| Measurement | Ottawa | Immigrants from Chile |
| Minimum | 0.29% | 1.3% |
| Maximum | 5.2% | 3.5% |
| Range | 4.9% | 2.1% |
| Mean | 1.4% | 2.3% |
| Median | 1.2% | 2.1% |
| Interquartile 25% (IQ1) | 0.70% | 2.0% |
| Interquartile 75% (IQ3) | 1.8% | 2.5% |
| Interquartile Range (IQR) | 1.1% | 0.58% |
| Standard Deviation (Sample) | 1.1% | 0.51% |
| Standard Deviation (Population) | 1.0% | 0.50% |
Similar Demographics by Doctorate Degree
Demographics Similar to Ottawa by Doctorate Degree
In terms of doctorate degree, the demographic groups most similar to Ottawa are Native Hawaiian (1.6%, a difference of 0.13%), Cheyenne (1.6%, a difference of 0.21%), French American Indian (1.6%, a difference of 0.32%), Immigrants from Panama (1.6%, a difference of 0.40%), and West Indian (1.6%, a difference of 0.59%).
| Demographics | Rating | Rank | Doctorate Degree |
| Cree | 3.0 /100 | #235 | Tragic 1.6% |
| Indonesians | 2.8 /100 | #236 | Tragic 1.6% |
| Iroquois | 2.7 /100 | #237 | Tragic 1.6% |
| Immigrants | Congo | 2.6 /100 | #238 | Tragic 1.6% |
| West Indians | 2.5 /100 | #239 | Tragic 1.6% |
| Immigrants | Panama | 2.4 /100 | #240 | Tragic 1.6% |
| Cheyenne | 2.3 /100 | #241 | Tragic 1.6% |
| Ottawa | 2.2 /100 | #242 | Tragic 1.6% |
| Native Hawaiians | 2.1 /100 | #243 | Tragic 1.6% |
| French American Indians | 2.0 /100 | #244 | Tragic 1.6% |
| Delaware | 1.9 /100 | #245 | Tragic 1.6% |
| Hmong | 1.8 /100 | #246 | Tragic 1.6% |
| Comanche | 1.8 /100 | #247 | Tragic 1.6% |
| Africans | 1.8 /100 | #248 | Tragic 1.6% |
| Potawatomi | 1.6 /100 | #249 | Tragic 1.6% |
Demographics Similar to Immigrants from Chile by Doctorate Degree
In terms of doctorate degree, the demographic groups most similar to Immigrants from Chile are Romanian (2.1%, a difference of 0.010%), Austrian (2.1%, a difference of 0.13%), Immigrants from Eastern Africa (2.1%, a difference of 0.22%), Immigrants from Egypt (2.1%, a difference of 0.25%), and Immigrants from Eastern Europe (2.1%, a difference of 0.25%).
| Demographics | Rating | Rank | Doctorate Degree |
| Immigrants | Romania | 98.7 /100 | #95 | Exceptional 2.1% |
| Immigrants | Northern Africa | 98.4 /100 | #96 | Exceptional 2.1% |
| Immigrants | Eritrea | 98.4 /100 | #97 | Exceptional 2.1% |
| Armenians | 98.3 /100 | #98 | Exceptional 2.1% |
| Immigrants | Egypt | 98.2 /100 | #99 | Exceptional 2.1% |
| Immigrants | Eastern Europe | 98.2 /100 | #100 | Exceptional 2.1% |
| Immigrants | Eastern Africa | 98.2 /100 | #101 | Exceptional 2.1% |
| Immigrants | Chile | 98.1 /100 | #102 | Exceptional 2.1% |
| Romanians | 98.1 /100 | #103 | Exceptional 2.1% |
| Austrians | 98.0 /100 | #104 | Exceptional 2.1% |
| Arabs | 97.8 /100 | #105 | Exceptional 2.1% |
| Sudanese | 97.7 /100 | #106 | Exceptional 2.1% |
| Europeans | 97.5 /100 | #107 | Exceptional 2.1% |
| Immigrants | Germany | 97.3 /100 | #108 | Exceptional 2.1% |
| Ukrainians | 97.2 /100 | #109 | Exceptional 2.1% |