Ottawa vs Immigrants from Austria Doctorate Degree

COMPARE

Ottawa
Race
Ancestry
AfghanAfricanAlaska NativeAlaskan AthabascanAlbanianAleutAlsatianAmericanApacheArabArapahoArgentineanArmenianAssyrian/Chaldean/SyriacAustralianAustrianBahamianBangladeshiBarbadianBasqueBelgianBelizeanBermudanBhutaneseBlackfeetBolivianBrazilianBritishBritish West IndianBulgarianBurmeseCajunCambodianCanadianCape VerdeanCarpatho RusynCelticCentral AmericanCentral American IndianCherokeeCheyenneChickasawChileanChineseChippewaChoctawColombianColvilleComancheCosta RicanCreeCreekCroatianCrowCubanCypriotCzechCzechoslovakianDanishDelawareDominicanDutchDutch West IndianEastern EuropeanEcuadorianEgyptianEnglishEstonianEthiopianEuropeanFijianFilipinoFinnishFrenchFrench American IndianFrench CanadianGermanGerman RussianGhanaianGreekGuamanian/ChamorroGuatemalanGuyaneseHaitianHmongHonduranHopiHoumaHungarianIcelanderIndian (Asian)IndonesianInupiatIranianIraqiIrishIroquoisIsraeliItalianJamaicanJapaneseJordanianKenyanKiowaKoreanLaotianLatvianLebaneseLiberianLithuanianLumbeeLuxembourgerMacedonianMalaysianMalteseMarshalleseMenomineeMexicanMexican American IndianMongolianMoroccanNative HawaiianNavajoNepaleseNew ZealanderNicaraguanNigerianNorthern EuropeanNorwegianOkinawanOsageOttawaPaiutePakistaniPalestinianPanamanianParaguayanPennsylvania GermanPeruvianPimaPolishPortuguesePotawatomiPuebloPuerto RicanPuget Sound SalishRomanianRussianSalvadoranSamoanScandinavianScotch-IrishScottishSeminoleSenegaleseSerbianShoshoneSierra LeoneanSiouxSlavicSlovakSloveneSomaliSouth AfricanSouth AmericanSouth American IndianSoviet UnionSpaniardSpanishSpanish AmericanSpanish American IndianSri LankanSubsaharan AfricanSudaneseSwedishSwissSyrianTaiwaneseThaiTlingit-HaidaTohono O'OdhamTonganTrinidadian and TobagonianTsimshianTurkishU.S. Virgin IslanderUgandanUkrainianUruguayanUteVenezuelanVietnameseWelshWest IndianYakamaYaquiYugoslavianYumanYup'ikZimbabwean
Immigration
NonimmigrantsImmigrantsAfghanistanAfricaAlbaniaArgentinaArmeniaAsiaAustraliaBahamasBangladeshBarbadosBelarusBelgiumBelizeBoliviaBosnia and HerzegovinaBrazilBulgariaBurma/MyanmarCabo VerdeCambodiaCameroonCanadaCaribbeanCentral AmericaChileChinaColombiaCongoCosta RicaCroatiaCubaCzechoslovakiaDenmarkDominicaDominican RepublicEastern AfricaEastern AsiaEastern EuropeEcuadorEgyptEl SalvadorEnglandEritreaEthiopiaEuropeFijiFranceGermanyGhanaGreeceGrenadaGuatemalaGuyanaHaitiHondurasHong KongHungaryIndiaIndonesiaIranIraqIrelandIsraelItalyJamaicaJapanJordanKazakhstanKenyaKoreaKuwaitLaosLatin AmericaLatviaLebanonLiberiaLithuaniaMalaysiaMexicoMicronesiaMiddle AfricaMoldovaMoroccoNepalNetherlandsNicaraguaNigeriaNorth AmericaNorth MacedoniaNorthern AfricaNorthern EuropeNorwayOceaniaPakistanPanamaPeruPhilippinesPolandPortugalRomaniaRussiaSaudi ArabiaScotlandSenegalSerbiaSierra LeoneSingaporeSomaliaSouth AfricaSouth AmericaSouth Central AsiaSouth Eastern AsiaSouthern EuropeSpainSri LankaSt. Vincent and the GrenadinesSudanSwedenSwitzerlandSyriaTaiwanThailandTrinidad and TobagoTurkeyUgandaUkraineUruguayUzbekistanVenezuelaVietnamWest IndiesWestern AfricaWestern AsiaWestern EuropeYemenZaireZimbabweAzores
Immigrants from Austria
Race
Ancestry
AfghanAfricanAlaska NativeAlaskan AthabascanAlbanianAleutAlsatianAmericanApacheArabArapahoArgentineanArmenianAssyrian/Chaldean/SyriacAustralianAustrianBahamianBangladeshiBarbadianBasqueBelgianBelizeanBermudanBhutaneseBlackfeetBolivianBrazilianBritishBritish West IndianBulgarianBurmeseCajunCambodianCanadianCape VerdeanCarpatho RusynCelticCentral AmericanCentral American IndianCherokeeCheyenneChickasawChileanChineseChippewaChoctawColombianColvilleComancheCosta RicanCreeCreekCroatianCrowCubanCypriotCzechCzechoslovakianDanishDelawareDominicanDutchDutch West IndianEastern EuropeanEcuadorianEgyptianEnglishEstonianEthiopianEuropeanFijianFilipinoFinnishFrenchFrench American IndianFrench CanadianGermanGerman RussianGhanaianGreekGuamanian/ChamorroGuatemalanGuyaneseHaitianHmongHonduranHopiHoumaHungarianIcelanderIndian (Asian)IndonesianInupiatIranianIraqiIrishIroquoisIsraeliItalianJamaicanJapaneseJordanianKenyanKiowaKoreanLaotianLatvianLebaneseLiberianLithuanianLumbeeLuxembourgerMacedonianMalaysianMalteseMarshalleseMenomineeMexicanMexican American IndianMongolianMoroccanNative HawaiianNavajoNepaleseNew ZealanderNicaraguanNigerianNorthern EuropeanNorwegianOkinawanOsagePaiutePakistaniPalestinianPanamanianParaguayanPennsylvania GermanPeruvianPimaPolishPortuguesePotawatomiPuebloPuerto RicanPuget Sound SalishRomanianRussianSalvadoranSamoanScandinavianScotch-IrishScottishSeminoleSenegaleseSerbianShoshoneSierra LeoneanSiouxSlavicSlovakSloveneSomaliSouth AfricanSouth AmericanSouth American IndianSoviet UnionSpaniardSpanishSpanish AmericanSpanish American IndianSri LankanSubsaharan AfricanSudaneseSwedishSwissSyrianTaiwaneseThaiTlingit-HaidaTohono O'OdhamTonganTrinidadian and TobagonianTsimshianTurkishU.S. Virgin IslanderUgandanUkrainianUruguayanUteVenezuelanVietnameseWelshWest IndianYakamaYaquiYugoslavianYumanYup'ikZimbabwean
Immigration
NonimmigrantsImmigrantsAfghanistanAfricaAlbaniaArgentinaArmeniaAsiaAustraliaAustriaBahamasBangladeshBarbadosBelarusBelgiumBelizeBoliviaBosnia and HerzegovinaBrazilBulgariaBurma/MyanmarCabo VerdeCambodiaCameroonCanadaCaribbeanCentral AmericaChileChinaColombiaCongoCosta RicaCroatiaCubaCzechoslovakiaDenmarkDominicaDominican RepublicEastern AfricaEastern AsiaEastern EuropeEcuadorEgyptEl SalvadorEnglandEritreaEthiopiaEuropeFijiFranceGermanyGhanaGreeceGrenadaGuatemalaGuyanaHaitiHondurasHong KongHungaryIndiaIndonesiaIranIraqIrelandIsraelItalyJamaicaJapanJordanKazakhstanKenyaKoreaKuwaitLaosLatin AmericaLatviaLebanonLiberiaLithuaniaMalaysiaMexicoMicronesiaMiddle AfricaMoldovaMoroccoNepalNetherlandsNicaraguaNigeriaNorth AmericaNorth MacedoniaNorthern AfricaNorthern EuropeNorwayOceaniaPakistanPanamaPeruPhilippinesPolandPortugalRomaniaRussiaSaudi ArabiaScotlandSenegalSerbiaSierra LeoneSingaporeSomaliaSouth AfricaSouth AmericaSouth Central AsiaSouth Eastern AsiaSouthern EuropeSpainSri LankaSt. Vincent and the GrenadinesSudanSwedenSwitzerlandSyriaTaiwanThailandTrinidad and TobagoTurkeyUgandaUkraineUruguayUzbekistanVenezuelaVietnamWest IndiesWestern AfricaWestern AsiaWestern EuropeYemenZaireZimbabweAzores
Doctorate Degree
Income
Poverty
Unemployment
Labor Participation
Family Structure
Vehicle Availability
Education Level
Disability

Doctorate Degree Comparison

Ottawa

Immigrants from Austria

Tragic
Exceptional
1.6%
DOCTORATE DEGREE
2.2/ 100
METRIC RATING
242nd/ 347
METRIC RANK
2.4%
DOCTORATE DEGREE
100.0/ 100
METRIC RATING
46th/ 347
METRIC RANK

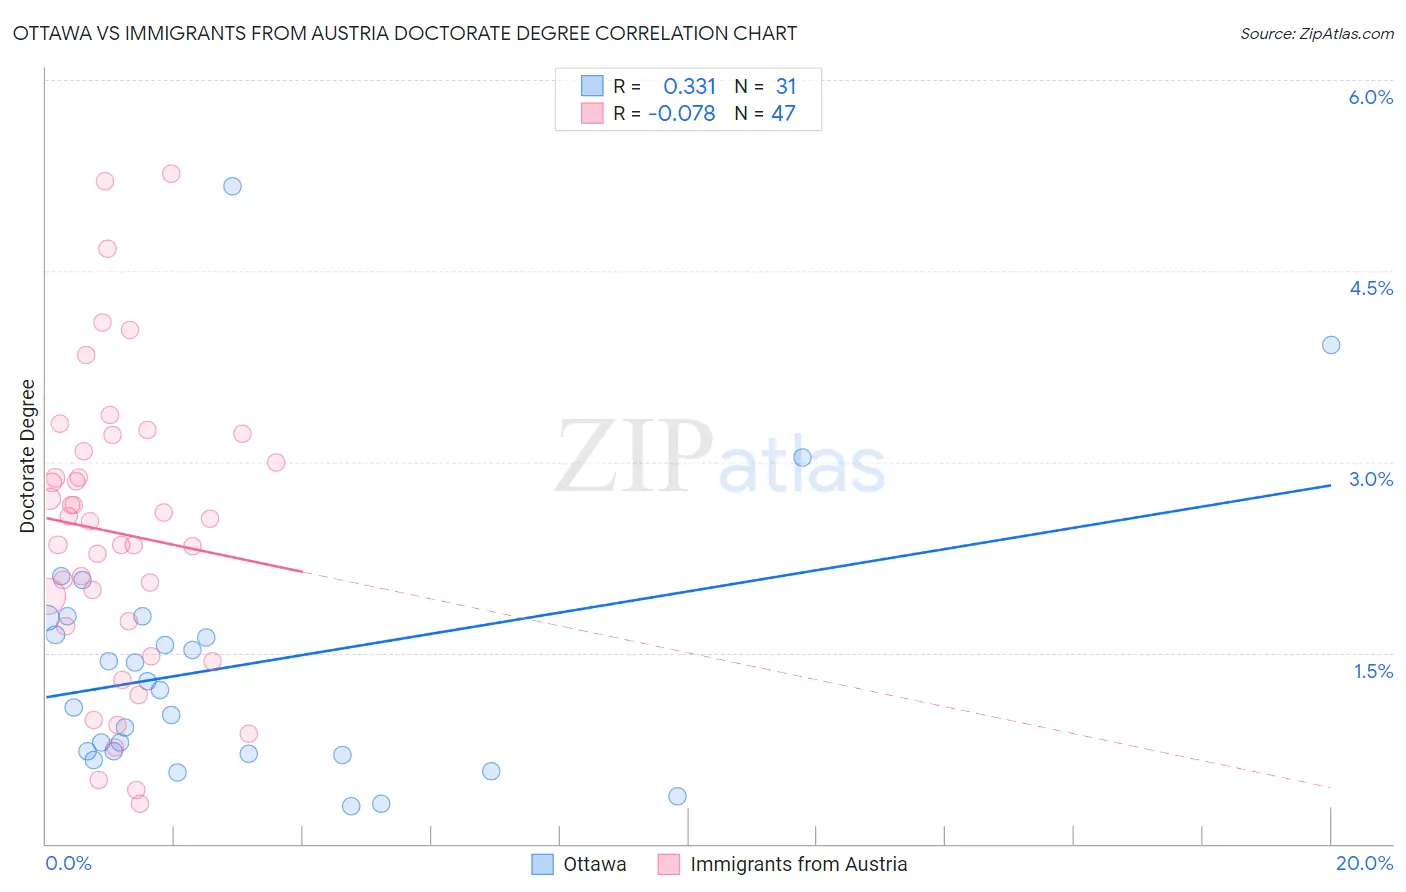
Ottawa vs Immigrants from Austria Doctorate Degree Correlation Chart

The statistical analysis conducted on geographies consisting of 49,607,860 people shows a mild positive correlation between the proportion of Ottawa and percentage of population with at least doctorate degree education in the United States with a correlation coefficient (R) of 0.331 and weighted average of 1.6%. Similarly, the statistical analysis conducted on geographies consisting of 167,487,271 people shows a slight negative correlation between the proportion of Immigrants from Austria and percentage of population with at least doctorate degree education in the United States with a correlation coefficient (R) of -0.078 and weighted average of 2.4%, a difference of 54.1%.
Ottawa vs Immigrants from Austria Doctorate Degree

Doctorate Degree Correlation Summary

MeasurementOttawaImmigrants from Austria
Minimum0.29%0.31%
Maximum5.2%5.3%
Range4.9%4.9%
Mean1.4%2.4%
Median1.2%2.5%
Interquartile 25% (IQ1)0.70%1.7%
Interquartile 75% (IQ3)1.8%3.1%
Interquartile Range (IQR)1.1%1.4%
Standard Deviation (Sample)1.1%1.2%
Standard Deviation (Population)1.0%1.1%

Similar Demographics by Doctorate Degree

Demographics Similar to Ottawa by Doctorate Degree

In terms of doctorate degree, the demographic groups most similar to Ottawa are Native Hawaiian (1.6%, a difference of 0.13%), Cheyenne (1.6%, a difference of 0.21%), French American Indian (1.6%, a difference of 0.32%), Immigrants from Panama (1.6%, a difference of 0.40%), and West Indian (1.6%, a difference of 0.59%).
DemographicsRating | RankDoctorate Degree
Cree
3.0
/100
|
#235
Tragic
1.6%
Indonesians
2.8
/100
|
#236
Tragic
1.6%
Iroquois
2.7
/100
|
#237
Tragic
1.6%
Immigrants | Congo
2.6
/100
|
#238
Tragic
1.6%
West Indians
2.5
/100
|
#239
Tragic
1.6%
Immigrants | Panama
2.4
/100
|
#240
Tragic
1.6%
Cheyenne
2.3
/100
|
#241
Tragic
1.6%
Ottawa
2.2
/100
|
#242
Tragic
1.6%
Native Hawaiians
2.1
/100
|
#243
Tragic
1.6%
French American Indians
2.0
/100
|
#244
Tragic
1.6%
Delaware
1.9
/100
|
#245
Tragic
1.6%
Hmong
1.8
/100
|
#246
Tragic
1.6%
Comanche
1.8
/100
|
#247
Tragic
1.6%
Africans
1.8
/100
|
#248
Tragic
1.6%
Potawatomi
1.6
/100
|
#249
Tragic
1.6%

Demographics Similar to Immigrants from Austria by Doctorate Degree

In terms of doctorate degree, the demographic groups most similar to Immigrants from Austria are Immigrants from South Africa (2.4%, a difference of 0.14%), Immigrants from Western Europe (2.4%, a difference of 0.22%), Asian (2.4%, a difference of 0.44%), Immigrants from Asia (2.4%, a difference of 0.57%), and Immigrants from Netherlands (2.5%, a difference of 1.7%).
DemographicsRating | RankDoctorate Degree
Immigrants | Ireland
100.0
/100
|
#39
Exceptional
2.5%
Estonians
100.0
/100
|
#40
Exceptional
2.5%
Immigrants | Russia
100.0
/100
|
#41
Exceptional
2.5%
New Zealanders
100.0
/100
|
#42
Exceptional
2.5%
Soviet Union
100.0
/100
|
#43
Exceptional
2.5%
Immigrants | Netherlands
100.0
/100
|
#44
Exceptional
2.5%
Immigrants | South Africa
100.0
/100
|
#45
Exceptional
2.4%
Immigrants | Austria
100.0
/100
|
#46
Exceptional
2.4%
Immigrants | Western Europe
100.0
/100
|
#47
Exceptional
2.4%
Asians
100.0
/100
|
#48
Exceptional
2.4%
Immigrants | Asia
100.0
/100
|
#49
Exceptional
2.4%
Immigrants | Norway
100.0
/100
|
#50
Exceptional
2.4%
Australians
100.0
/100
|
#51
Exceptional
2.4%
Bulgarians
100.0
/100
|
#52
Exceptional
2.4%
Immigrants | Latvia
100.0
/100
|
#53
Exceptional
2.4%