Okinawan vs Immigrants from Russia College, 1 year or more
COMPARE
Okinawan
Immigrants from Russia
College, 1 year or more
College, 1 year or more Comparison
Okinawans
Immigrants from Russia
69.0%
COLLEGE, 1 YEAR OR MORE
100.0/ 100
METRIC RATING
7th/ 347
METRIC RANK
64.7%
COLLEGE, 1 YEAR OR MORE
99.9/ 100
METRIC RATING
43rd/ 347
METRIC RANK
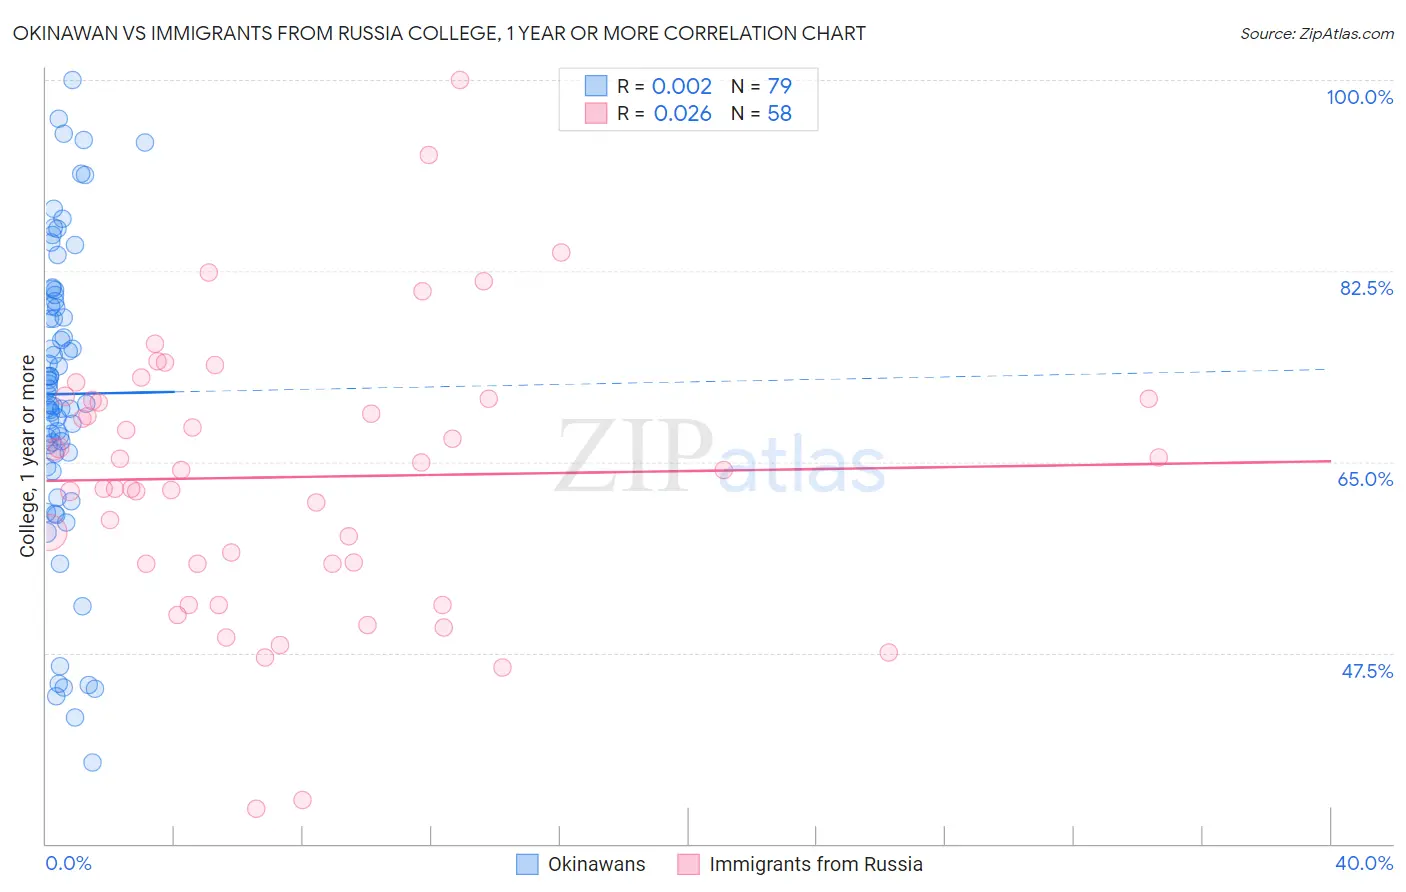
Okinawan vs Immigrants from Russia College, 1 year or more Correlation Chart
The statistical analysis conducted on geographies consisting of 73,779,368 people shows no correlation between the proportion of Okinawans and percentage of population with at least college, 1 year or more education in the United States with a correlation coefficient (R) of 0.002 and weighted average of 69.0%. Similarly, the statistical analysis conducted on geographies consisting of 347,945,922 people shows no correlation between the proportion of Immigrants from Russia and percentage of population with at least college, 1 year or more education in the United States with a correlation coefficient (R) of 0.026 and weighted average of 64.7%, a difference of 6.5%.
College, 1 year or more Correlation Summary
| Measurement | Okinawan | Immigrants from Russia |
| Minimum | 37.5% | 33.2% |
| Maximum | 100.0% | 100.0% |
| Range | 62.5% | 66.8% |
| Mean | 71.2% | 63.6% |
| Median | 71.2% | 64.2% |
| Interquartile 25% (IQ1) | 65.7% | 55.7% |
| Interquartile 75% (IQ3) | 79.7% | 70.8% |
| Interquartile Range (IQR) | 14.0% | 15.1% |
| Standard Deviation (Sample) | 13.7% | 12.6% |
| Standard Deviation (Population) | 13.6% | 12.5% |
Similar Demographics by College, 1 year or more
Demographics Similar to Okinawans by College, 1 year or more
In terms of college, 1 year or more, the demographic groups most similar to Okinawans are Thai (68.6%, a difference of 0.54%), Immigrants from Iran (69.5%, a difference of 0.77%), Immigrants from Taiwan (69.6%, a difference of 0.97%), Immigrants from India (69.6%, a difference of 0.97%), and Iranian (70.0%, a difference of 1.5%).
| Demographics | Rating | Rank | College, 1 year or more |
| Filipinos | 100.0 /100 | #1 | Exceptional 71.0% |
| Immigrants | Singapore | 100.0 /100 | #2 | Exceptional 70.1% |
| Iranians | 100.0 /100 | #3 | Exceptional 70.0% |
| Immigrants | Taiwan | 100.0 /100 | #4 | Exceptional 69.6% |
| Immigrants | India | 100.0 /100 | #5 | Exceptional 69.6% |
| Immigrants | Iran | 100.0 /100 | #6 | Exceptional 69.5% |
| Okinawans | 100.0 /100 | #7 | Exceptional 69.0% |
| Thais | 100.0 /100 | #8 | Exceptional 68.6% |
| Immigrants | Israel | 100.0 /100 | #9 | Exceptional 67.8% |
| Immigrants | Australia | 100.0 /100 | #10 | Exceptional 67.7% |
| Immigrants | South Central Asia | 100.0 /100 | #11 | Exceptional 67.1% |
| Cypriots | 100.0 /100 | #12 | Exceptional 67.0% |
| Immigrants | Sweden | 100.0 /100 | #13 | Exceptional 66.8% |
| Burmese | 100.0 /100 | #14 | Exceptional 66.7% |
| Cambodians | 100.0 /100 | #15 | Exceptional 66.7% |
Demographics Similar to Immigrants from Russia by College, 1 year or more
In terms of college, 1 year or more, the demographic groups most similar to Immigrants from Russia are Immigrants from Norway (64.7%, a difference of 0.020%), Immigrants from Latvia (64.8%, a difference of 0.12%), Mongolian (64.8%, a difference of 0.13%), Immigrants from Lithuania (64.6%, a difference of 0.19%), and Bhutanese (64.6%, a difference of 0.20%).
| Demographics | Rating | Rank | College, 1 year or more |
| Immigrants | South Africa | 99.9 /100 | #36 | Exceptional 65.1% |
| Russians | 99.9 /100 | #37 | Exceptional 65.1% |
| Immigrants | Saudi Arabia | 99.9 /100 | #38 | Exceptional 65.0% |
| Estonians | 99.9 /100 | #39 | Exceptional 65.0% |
| Immigrants | Kuwait | 99.9 /100 | #40 | Exceptional 65.0% |
| Mongolians | 99.9 /100 | #41 | Exceptional 64.8% |
| Immigrants | Latvia | 99.9 /100 | #42 | Exceptional 64.8% |
| Immigrants | Russia | 99.9 /100 | #43 | Exceptional 64.7% |
| Immigrants | Norway | 99.9 /100 | #44 | Exceptional 64.7% |
| Immigrants | Lithuania | 99.9 /100 | #45 | Exceptional 64.6% |
| Bhutanese | 99.9 /100 | #46 | Exceptional 64.6% |
| Australians | 99.9 /100 | #47 | Exceptional 64.6% |
| Immigrants | Bulgaria | 99.9 /100 | #48 | Exceptional 64.6% |
| New Zealanders | 99.9 /100 | #49 | Exceptional 64.6% |
| Immigrants | Austria | 99.8 /100 | #50 | Exceptional 64.4% |