Okinawan vs Central American Indian College, 1 year or more
COMPARE
Okinawan
Central American Indian
College, 1 year or more
College, 1 year or more Comparison
Okinawans
Central American Indians
69.0%
COLLEGE, 1 YEAR OR MORE
100.0/ 100
METRIC RATING
7th/ 347
METRIC RANK
53.5%
COLLEGE, 1 YEAR OR MORE
0.1/ 100
METRIC RATING
286th/ 347
METRIC RANK
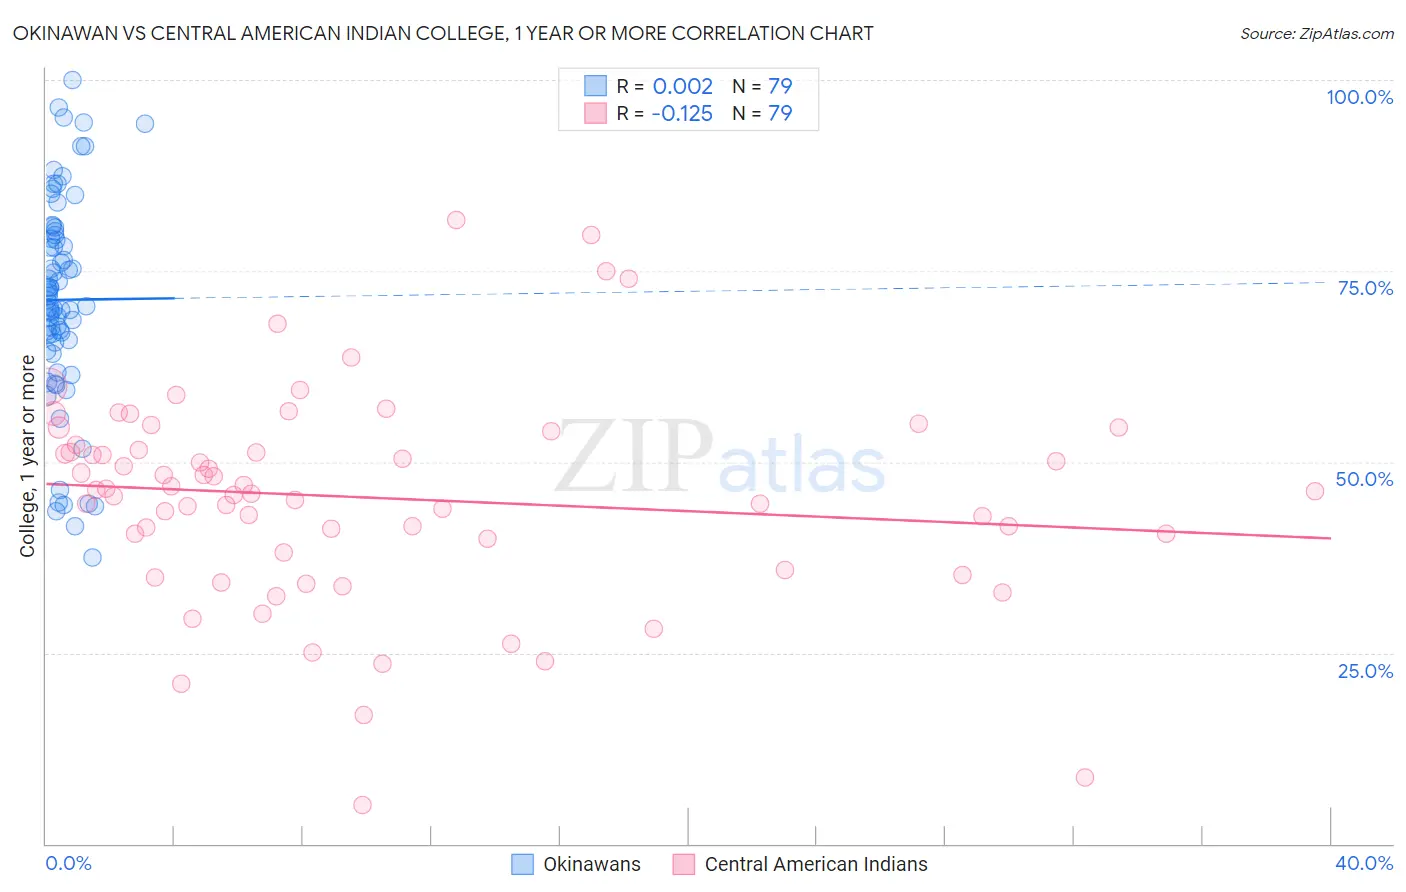
Okinawan vs Central American Indian College, 1 year or more Correlation Chart
The statistical analysis conducted on geographies consisting of 73,779,368 people shows no correlation between the proportion of Okinawans and percentage of population with at least college, 1 year or more education in the United States with a correlation coefficient (R) of 0.002 and weighted average of 69.0%. Similarly, the statistical analysis conducted on geographies consisting of 326,142,624 people shows a poor negative correlation between the proportion of Central American Indians and percentage of population with at least college, 1 year or more education in the United States with a correlation coefficient (R) of -0.125 and weighted average of 53.5%, a difference of 28.8%.
College, 1 year or more Correlation Summary
| Measurement | Okinawan | Central American Indian |
| Minimum | 37.5% | 5.1% |
| Maximum | 100.0% | 81.6% |
| Range | 62.5% | 76.5% |
| Mean | 71.2% | 45.3% |
| Median | 71.2% | 46.2% |
| Interquartile 25% (IQ1) | 65.7% | 38.2% |
| Interquartile 75% (IQ3) | 79.7% | 52.2% |
| Interquartile Range (IQR) | 14.0% | 14.0% |
| Standard Deviation (Sample) | 13.7% | 13.9% |
| Standard Deviation (Population) | 13.6% | 13.9% |
Similar Demographics by College, 1 year or more
Demographics Similar to Okinawans by College, 1 year or more
In terms of college, 1 year or more, the demographic groups most similar to Okinawans are Thai (68.6%, a difference of 0.54%), Immigrants from Iran (69.5%, a difference of 0.77%), Immigrants from Taiwan (69.6%, a difference of 0.97%), Immigrants from India (69.6%, a difference of 0.97%), and Iranian (70.0%, a difference of 1.5%).
| Demographics | Rating | Rank | College, 1 year or more |
| Filipinos | 100.0 /100 | #1 | Exceptional 71.0% |
| Immigrants | Singapore | 100.0 /100 | #2 | Exceptional 70.1% |
| Iranians | 100.0 /100 | #3 | Exceptional 70.0% |
| Immigrants | Taiwan | 100.0 /100 | #4 | Exceptional 69.6% |
| Immigrants | India | 100.0 /100 | #5 | Exceptional 69.6% |
| Immigrants | Iran | 100.0 /100 | #6 | Exceptional 69.5% |
| Okinawans | 100.0 /100 | #7 | Exceptional 69.0% |
| Thais | 100.0 /100 | #8 | Exceptional 68.6% |
| Immigrants | Israel | 100.0 /100 | #9 | Exceptional 67.8% |
| Immigrants | Australia | 100.0 /100 | #10 | Exceptional 67.7% |
| Immigrants | South Central Asia | 100.0 /100 | #11 | Exceptional 67.1% |
| Cypriots | 100.0 /100 | #12 | Exceptional 67.0% |
| Immigrants | Sweden | 100.0 /100 | #13 | Exceptional 66.8% |
| Burmese | 100.0 /100 | #14 | Exceptional 66.7% |
| Cambodians | 100.0 /100 | #15 | Exceptional 66.7% |
Demographics Similar to Central American Indians by College, 1 year or more
In terms of college, 1 year or more, the demographic groups most similar to Central American Indians are Immigrants from Belize (53.5%, a difference of 0.030%), Immigrants from Guyana (53.5%, a difference of 0.040%), Alaska Native (53.4%, a difference of 0.20%), Immigrants from Ecuador (53.4%, a difference of 0.21%), and Alaskan Athabascan (53.4%, a difference of 0.22%).
| Demographics | Rating | Rank | College, 1 year or more |
| Arapaho | 0.1 /100 | #279 | Tragic 54.1% |
| Cheyenne | 0.1 /100 | #280 | Tragic 54.1% |
| Colville | 0.1 /100 | #281 | Tragic 54.1% |
| Guyanese | 0.1 /100 | #282 | Tragic 54.1% |
| Nicaraguans | 0.1 /100 | #283 | Tragic 53.9% |
| Ute | 0.1 /100 | #284 | Tragic 53.8% |
| Immigrants | Guyana | 0.1 /100 | #285 | Tragic 53.5% |
| Central American Indians | 0.1 /100 | #286 | Tragic 53.5% |
| Immigrants | Belize | 0.1 /100 | #287 | Tragic 53.5% |
| Alaska Natives | 0.0 /100 | #288 | Tragic 53.4% |
| Immigrants | Ecuador | 0.0 /100 | #289 | Tragic 53.4% |
| Alaskan Athabascans | 0.0 /100 | #290 | Tragic 53.4% |
| Cubans | 0.0 /100 | #291 | Tragic 53.4% |
| Chickasaw | 0.0 /100 | #292 | Tragic 53.3% |
| Blacks/African Americans | 0.0 /100 | #293 | Tragic 53.3% |