Northern European vs Uruguayan 11th Grade
COMPARE
Northern European
Uruguayan
11th Grade
11th Grade Comparison
Northern Europeans
Uruguayans
94.2%
11TH GRADE
99.9/ 100
METRIC RATING
37th/ 347
METRIC RANK
91.8%
11TH GRADE
3.5/ 100
METRIC RATING
232nd/ 347
METRIC RANK
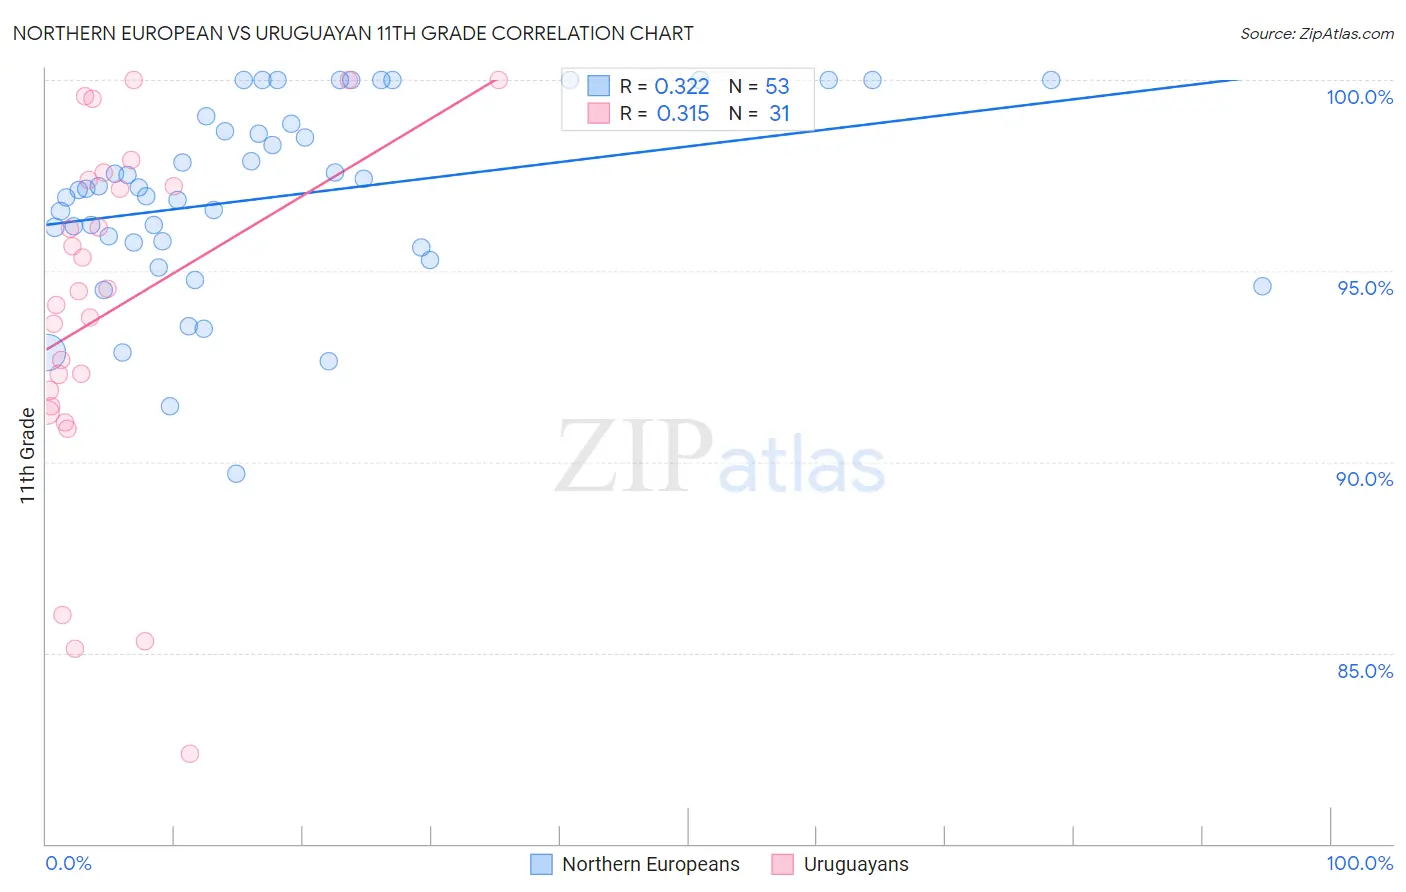
Northern European vs Uruguayan 11th Grade Correlation Chart
The statistical analysis conducted on geographies consisting of 406,096,351 people shows a mild positive correlation between the proportion of Northern Europeans and percentage of population with at least 11th grade education in the United States with a correlation coefficient (R) of 0.322 and weighted average of 94.2%. Similarly, the statistical analysis conducted on geographies consisting of 144,782,615 people shows a mild positive correlation between the proportion of Uruguayans and percentage of population with at least 11th grade education in the United States with a correlation coefficient (R) of 0.315 and weighted average of 91.8%, a difference of 2.6%.
11th Grade Correlation Summary
| Measurement | Northern European | Uruguayan |
| Minimum | 89.7% | 82.4% |
| Maximum | 100.0% | 100.0% |
| Range | 10.3% | 17.6% |
| Mean | 97.0% | 94.0% |
| Median | 97.2% | 94.5% |
| Interquartile 25% (IQ1) | 95.7% | 91.5% |
| Interquartile 75% (IQ3) | 98.9% | 97.4% |
| Interquartile Range (IQR) | 3.3% | 5.9% |
| Standard Deviation (Sample) | 2.5% | 4.6% |
| Standard Deviation (Population) | 2.5% | 4.6% |
Similar Demographics by 11th Grade
Demographics Similar to Northern Europeans by 11th Grade
In terms of 11th grade, the demographic groups most similar to Northern Europeans are Hungarian (94.2%, a difference of 0.0%), Immigrants from Singapore (94.2%, a difference of 0.010%), Immigrants from Northern Europe (94.2%, a difference of 0.010%), British (94.2%, a difference of 0.020%), and Immigrants from Scotland (94.2%, a difference of 0.020%).
| Demographics | Rating | Rank | 11th Grade |
| Russians | 100.0 /100 | #30 | Exceptional 94.3% |
| Welsh | 99.9 /100 | #31 | Exceptional 94.2% |
| Belgians | 99.9 /100 | #32 | Exceptional 94.2% |
| British | 99.9 /100 | #33 | Exceptional 94.2% |
| Immigrants | Scotland | 99.9 /100 | #34 | Exceptional 94.2% |
| Immigrants | Singapore | 99.9 /100 | #35 | Exceptional 94.2% |
| Immigrants | Northern Europe | 99.9 /100 | #36 | Exceptional 94.2% |
| Northern Europeans | 99.9 /100 | #37 | Exceptional 94.2% |
| Hungarians | 99.9 /100 | #38 | Exceptional 94.2% |
| Immigrants | Lithuania | 99.9 /100 | #39 | Exceptional 94.1% |
| Thais | 99.9 /100 | #40 | Exceptional 94.1% |
| Cypriots | 99.9 /100 | #41 | Exceptional 94.1% |
| Immigrants | Austria | 99.9 /100 | #42 | Exceptional 94.1% |
| Greeks | 99.9 /100 | #43 | Exceptional 94.1% |
| Immigrants | Ireland | 99.9 /100 | #44 | Exceptional 94.1% |
Demographics Similar to Uruguayans by 11th Grade
In terms of 11th grade, the demographic groups most similar to Uruguayans are Cheyenne (91.8%, a difference of 0.010%), Choctaw (91.8%, a difference of 0.020%), Immigrants from Afghanistan (91.8%, a difference of 0.030%), Armenian (91.7%, a difference of 0.040%), and Nigerian (91.8%, a difference of 0.050%).
| Demographics | Rating | Rank | 11th Grade |
| Immigrants | Zaire | 5.4 /100 | #225 | Tragic 91.9% |
| Immigrants | Somalia | 5.2 /100 | #226 | Tragic 91.9% |
| Immigrants | Cameroon | 4.4 /100 | #227 | Tragic 91.8% |
| Immigrants | Panama | 4.3 /100 | #228 | Tragic 91.8% |
| Nigerians | 4.3 /100 | #229 | Tragic 91.8% |
| Immigrants | Afghanistan | 3.9 /100 | #230 | Tragic 91.8% |
| Choctaw | 3.7 /100 | #231 | Tragic 91.8% |
| Uruguayans | 3.5 /100 | #232 | Tragic 91.8% |
| Cheyenne | 3.3 /100 | #233 | Tragic 91.8% |
| Armenians | 2.9 /100 | #234 | Tragic 91.7% |
| Sub-Saharan Africans | 2.9 /100 | #235 | Tragic 91.7% |
| Colombians | 2.8 /100 | #236 | Tragic 91.7% |
| Immigrants | Bolivia | 2.8 /100 | #237 | Tragic 91.7% |
| Comanche | 2.6 /100 | #238 | Tragic 91.7% |
| Hopi | 2.5 /100 | #239 | Tragic 91.7% |