Northern European vs Immigrants from Canada 11th Grade
COMPARE
Northern European
Immigrants from Canada
11th Grade
11th Grade Comparison
Northern Europeans
Immigrants from Canada
94.2%
11TH GRADE
99.9/ 100
METRIC RATING
37th/ 347
METRIC RANK
94.0%
11TH GRADE
99.9/ 100
METRIC RATING
52nd/ 347
METRIC RANK
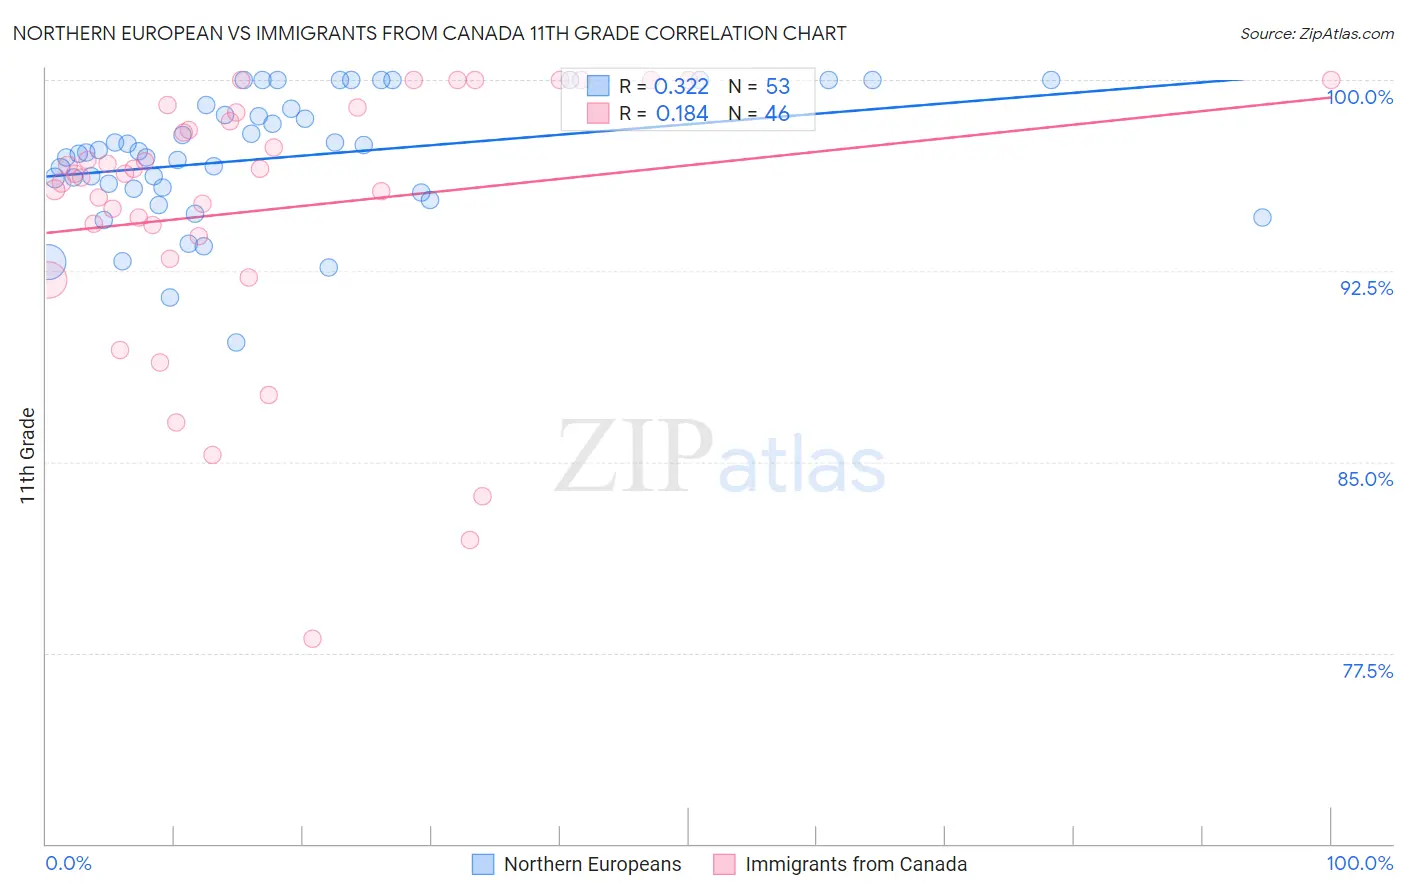
Northern European vs Immigrants from Canada 11th Grade Correlation Chart
The statistical analysis conducted on geographies consisting of 406,096,351 people shows a mild positive correlation between the proportion of Northern Europeans and percentage of population with at least 11th grade education in the United States with a correlation coefficient (R) of 0.322 and weighted average of 94.2%. Similarly, the statistical analysis conducted on geographies consisting of 459,397,067 people shows a poor positive correlation between the proportion of Immigrants from Canada and percentage of population with at least 11th grade education in the United States with a correlation coefficient (R) of 0.184 and weighted average of 94.0%, a difference of 0.18%.
11th Grade Correlation Summary
| Measurement | Northern European | Immigrants from Canada |
| Minimum | 89.7% | 78.1% |
| Maximum | 100.0% | 100.0% |
| Range | 10.3% | 21.9% |
| Mean | 97.0% | 94.9% |
| Median | 97.2% | 96.3% |
| Interquartile 25% (IQ1) | 95.7% | 93.9% |
| Interquartile 75% (IQ3) | 98.9% | 98.7% |
| Interquartile Range (IQR) | 3.3% | 4.9% |
| Standard Deviation (Sample) | 2.5% | 5.2% |
| Standard Deviation (Population) | 2.5% | 5.2% |
Demographics Similar to Northern Europeans and Immigrants from Canada by 11th Grade
In terms of 11th grade, the demographic groups most similar to Northern Europeans are Hungarian (94.2%, a difference of 0.0%), Immigrants from Singapore (94.2%, a difference of 0.010%), Immigrants from Northern Europe (94.2%, a difference of 0.010%), Immigrants from Scotland (94.2%, a difference of 0.020%), and Immigrants from Lithuania (94.1%, a difference of 0.060%). Similarly, the demographic groups most similar to Immigrants from Canada are Turkish (94.0%, a difference of 0.010%), Immigrants from Australia (94.0%, a difference of 0.010%), Immigrants from North America (94.0%, a difference of 0.020%), Macedonian (94.1%, a difference of 0.040%), and Slavic (94.1%, a difference of 0.040%).
| Demographics | Rating | Rank | 11th Grade |
| Immigrants | Scotland | 99.9 /100 | #34 | Exceptional 94.2% |
| Immigrants | Singapore | 99.9 /100 | #35 | Exceptional 94.2% |
| Immigrants | Northern Europe | 99.9 /100 | #36 | Exceptional 94.2% |
| Northern Europeans | 99.9 /100 | #37 | Exceptional 94.2% |
| Hungarians | 99.9 /100 | #38 | Exceptional 94.2% |
| Immigrants | Lithuania | 99.9 /100 | #39 | Exceptional 94.1% |
| Thais | 99.9 /100 | #40 | Exceptional 94.1% |
| Cypriots | 99.9 /100 | #41 | Exceptional 94.1% |
| Immigrants | Austria | 99.9 /100 | #42 | Exceptional 94.1% |
| Greeks | 99.9 /100 | #43 | Exceptional 94.1% |
| Immigrants | Ireland | 99.9 /100 | #44 | Exceptional 94.1% |
| Australians | 99.9 /100 | #45 | Exceptional 94.1% |
| Serbians | 99.9 /100 | #46 | Exceptional 94.1% |
| Filipinos | 99.9 /100 | #47 | Exceptional 94.1% |
| Macedonians | 99.9 /100 | #48 | Exceptional 94.1% |
| Slavs | 99.9 /100 | #49 | Exceptional 94.1% |
| French | 99.9 /100 | #50 | Exceptional 94.1% |
| Turks | 99.9 /100 | #51 | Exceptional 94.0% |
| Immigrants | Canada | 99.9 /100 | #52 | Exceptional 94.0% |
| Immigrants | Australia | 99.9 /100 | #53 | Exceptional 94.0% |
| Immigrants | North America | 99.9 /100 | #54 | Exceptional 94.0% |